This dashboard provides a distribution breakdown of the performance of all the Horizon VDI Sessions by pods and pools based on the Datacenter KPI and Network KPI metrics. It allows the administrator to view the related VDI sessions that are impacted by performance issues, and provides alerts and KPI breakdowns of the performance metrics impacting the user and the Horizon sessions.
Design Consideration
This dashboard provides a global view of the VDI Session performance across the Horizon deployment by pod and pool, to quickly identify KPIs and alerts impacting the performance of the user.
How to Use the Dashboard
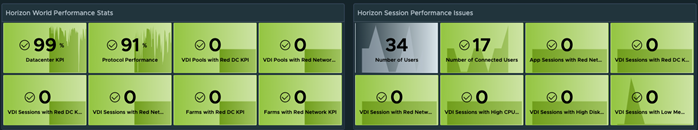
The Horizon World Performance and Horizon Session Scoreboard widgets provide a quick glance into the overall performance issues impacting the VDI Sessions from both a Datacenter and Network Protocol perspective. These widgets can be used to show the current overall performance and how the performance is trending over time.
Horizon pods with degraded performance can be viewed by their Datacenter KPI(%) and Network KPI (%) in the Pod DC Performance and Pod Network Performance widgets. By selecting a distribution performance bucket and selecting a pod from the available list, the dashboard updates to provide a quick distribution analysis of all related KPIs and alerts, and breaks down the performance impact by pool in the Pool DC and Pool Network Performance widgets, and provide a breakdown of the KPI types (Protocol, CPU, Disk, and Memory) for that pod.
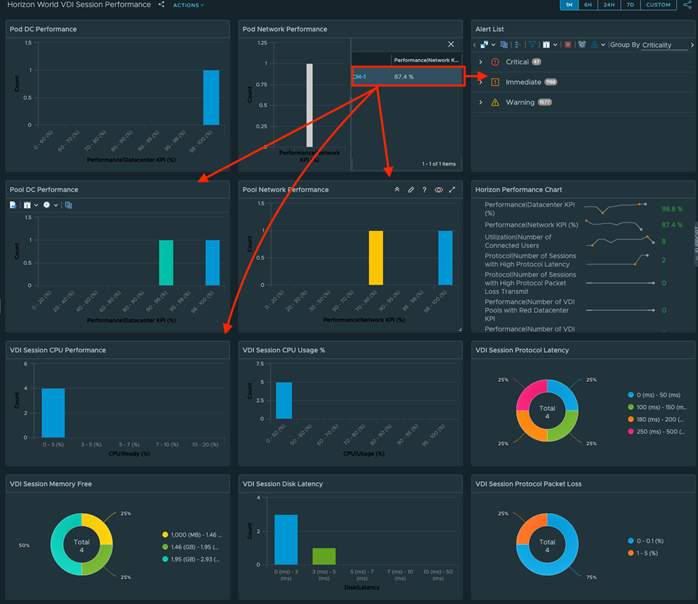
The Pool Performance Widgets are designed to highlight specific pools that might be having performance issues within a particular category, datacenter, or network protocol. Select a performance distribution bucket to see the pools that fall within the selected range, and select an individual pool for further analysis. The dashboard updates to provide a quick distribution analysis of the selected pool by Trending KPIs, alerts, and full KPI breakdowns (Protocol, CPU, Disk, and Memory).
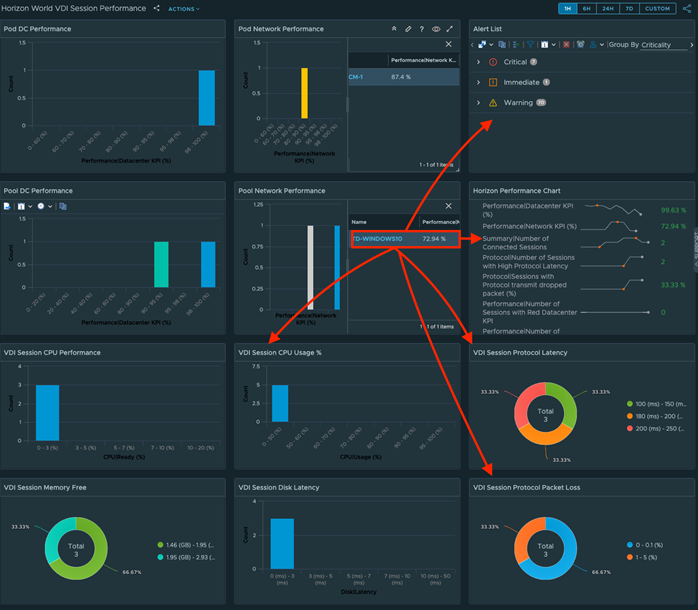
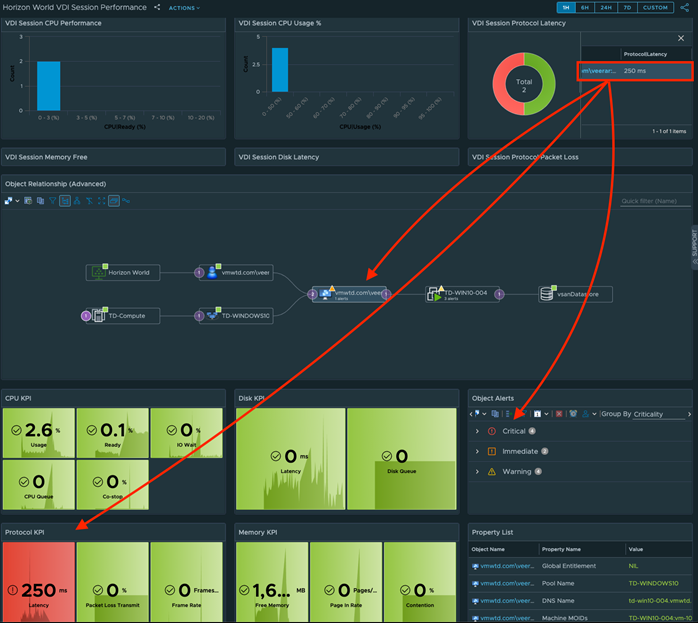
To continue the analysis, you can select a specific KPI widget to determine the sessions that have issues and select a VDI session to perform a quick analysis of all impacting KPIs.
Points to Note
In this dashboard, distributions are updates in the relevant sections of the dashboard and the associated object analysis is provided.
The Datacenter % and Network % KPIs are a combination of multiple performance metrics (CPU, Disk, Memory, and Protocol). The score reflected is directly impacted by the total number of sessions and performance issues measured in the Horizon environment.
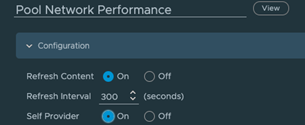
The performance KPI widgets are configured to change color based on symptoms from the defined alerts and can be set to hard-coded values by editing the widget.
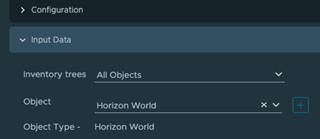
If you have a single or small number of pods, you can remove the pod distributions to show the Pool performance widgets. Their configuration must be updated so that they are self-providers and the Input Data object should be set to Horizon World.