


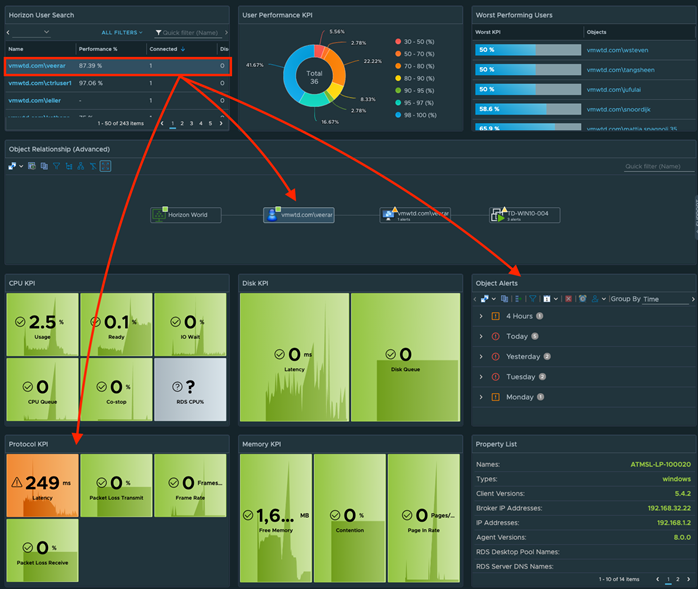
This dashboard provides user search functionality and allows for quick root cause analysis as to performance issues impacting user Horizon sessions. With user performance distribution and Top-N analysis of all Horizon users, you can quickly identify users with performance issues and provide KPI breakdown by performance category (CPU, Disk, Memory, and Protocol). This Dashboard also allows you to see the related VDI sessions that are impacted by the performance issues, and provides alerts by KPI impacting the user and Horizon sessions.
Design Consideration
To provide a global user search functionality and to quickly identify KPIs impacting user performance.
How to Use the Dashboard
- From the Horizon User Search widget, click the Eye on the widget title bar if the search box is not visible.
- In the Filter Object box, enter the Active Directory username (Domain\username) that you want to perform analysis on and click Enter.
The user name should appear in the widget if the user has logged into the Horizon Environment in the past 90 days.
- Select the user from the widget by clicking the space next to the Active Directory username.
This updates the dashboard to reflect the user object in the Object Relationship widget.
- Select the required object in the Object Relationship widget.
The KPIs and alerts currently active on that user are displayed in the widgets below.
If the user has one or more active sessions, you can select the individual sessions in the Object Relationship widget to see the specific KPIs and alerts are impacting the user’s individual sessions. You can navigate the Object Relationship widget to other Horizon objects (Pools, Farms, Pods, and so on) to see the relevant KPIs for those objects as well.
Any KPIs that are not green are considered to have performance issues those users and their corresponding sessions. Additional supporting KPIs are provided for additional performance analysis, but might not have configured color thresholds.
All KPI thresholds available in the widget can be adjusted directly in the widget edit section.
Points to Note
The User Performance KPI and Worst Performing Users widget can also be used to drive the interaction flow of the dashboard.
The users KPI score is an aggregated KPI of multiple performance impacting metrics (CPU, Disk, Memory, and Protocol). The score reflected is directly impacted by the number of sessions the user has and how many of them are experiencing issues.
The performance KPI widgets are configured to change color based on symptoms from the defined alerts, but they can be set to hard-coded values by editing the widget.
