


This dashboard provides a distribution breakdown of the performance of all the Horizon users by the user performance metric and by KPI category (CPU, Disk, Memory, and Protocol). It allows the administrator to view the related VDI sessions that are impacted by performance issues, and provides alerts and KPI breakdowns of the performance metrics impacting the user and the Horizon sessions.
Design Consideration
This dashboard provides a global view of the user performance across the Horizon deployment to quickly identify KPIs and alerts impacting the performance of the user.
How to Use the Dashboard
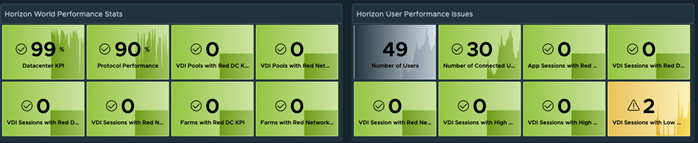
The Horizon World and Horizon User Scoreboard widgets provide a quick glance into the overall performance issues impacting the users from a datacenter and network protocol perspective. These widgets can be used to show current overall performance, as well as how the performance is trending over time.
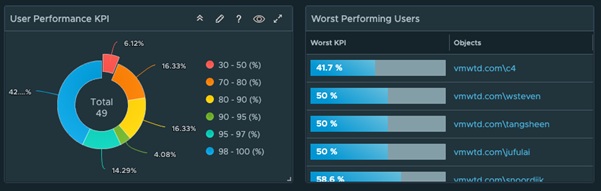
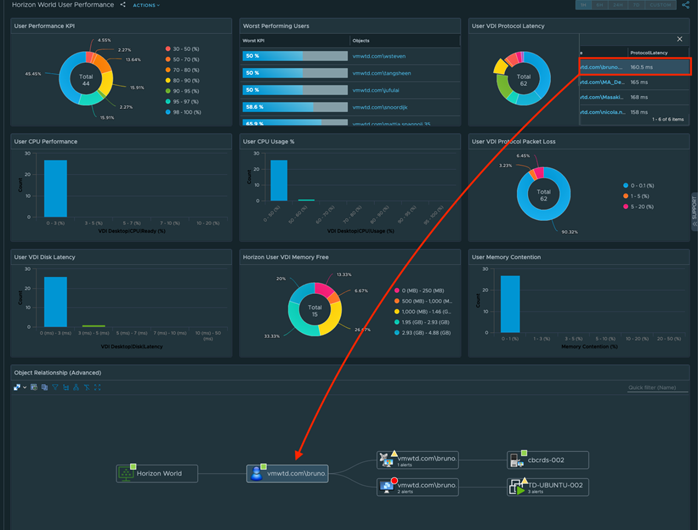
Horizon users with degraded performance can easily be identified in the User Performance KPI and Worst Performing KPI widgets using single User Performance KPI metric (Worst KPI (%)).
Click a distribution from the doughnut chart and allow it the administrator to see the users within the performance KPI bucket. Selecting a user within the widget updates the User Object Relationship and displays the Horizon sessions for that user. The critical performance KPIs and alerts on the user object are displayed in the corresponding widgets.
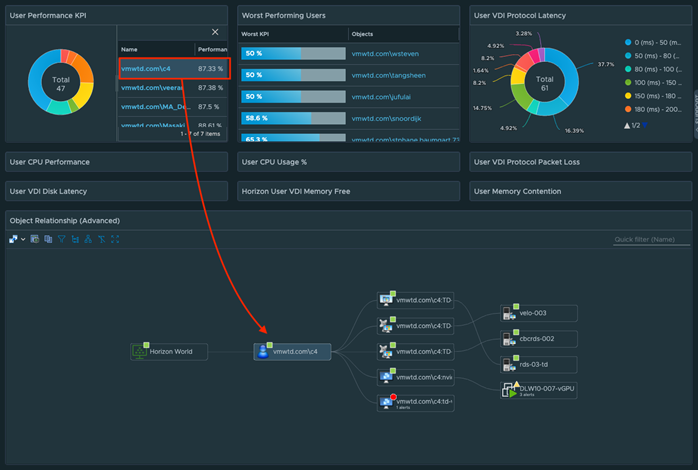
If the user has one or more active sessions, you can select the individual sessions in the Object Relationship widget to see the specific KPIs and alerts impacting the user’s individual sessions. You can also navigate the Object Relationship widget for other Horizon objects (Pools, Farms, Pods, and so on) to see the relevant KPIs for those objects.
Inactive or Disconnected sessions are displayed with a Grey Box or they do not have an associated VM or RDS Host.
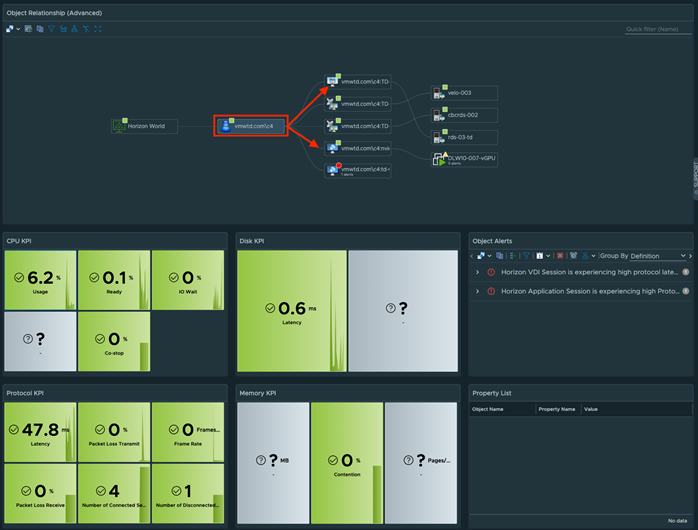
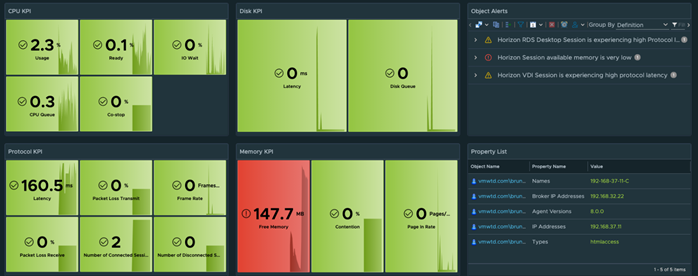
Any KPIs that are not green are considered to have a performance on the user and their corresponding sessions. Additional supporting KPIs are provided for additional performance analysis, but may not have configured color thresholds.
All KPI thresholds available in the widget may be adjusted directly in the widget’s edit section.
Administrators can also visualize the global user performance per KPI Distribution (Protocol or DC), and select the underperforming users from the additional widgets to begin their root cause analysis.
Points to Note
The users KPI score is an aggregated KPI of multiple performance impacting metrics (CPU, Disk, Memory, and Protocol), and the score reflected is directly impacted by the number of sessions the user has and how many of them are experiencing issues.
The performance KPI widgets are currently configured to change color based on symptoms from the defined alerts, but they can be set to hard-coded values by editing the widget.
