While searching for log events, you can group log events by multiple fields and see a time-series or non time-series visualization.
Procedure
- (Optional) Select one or more fields in the Group by section to group the log events by fields such as app name, hostname, and process.
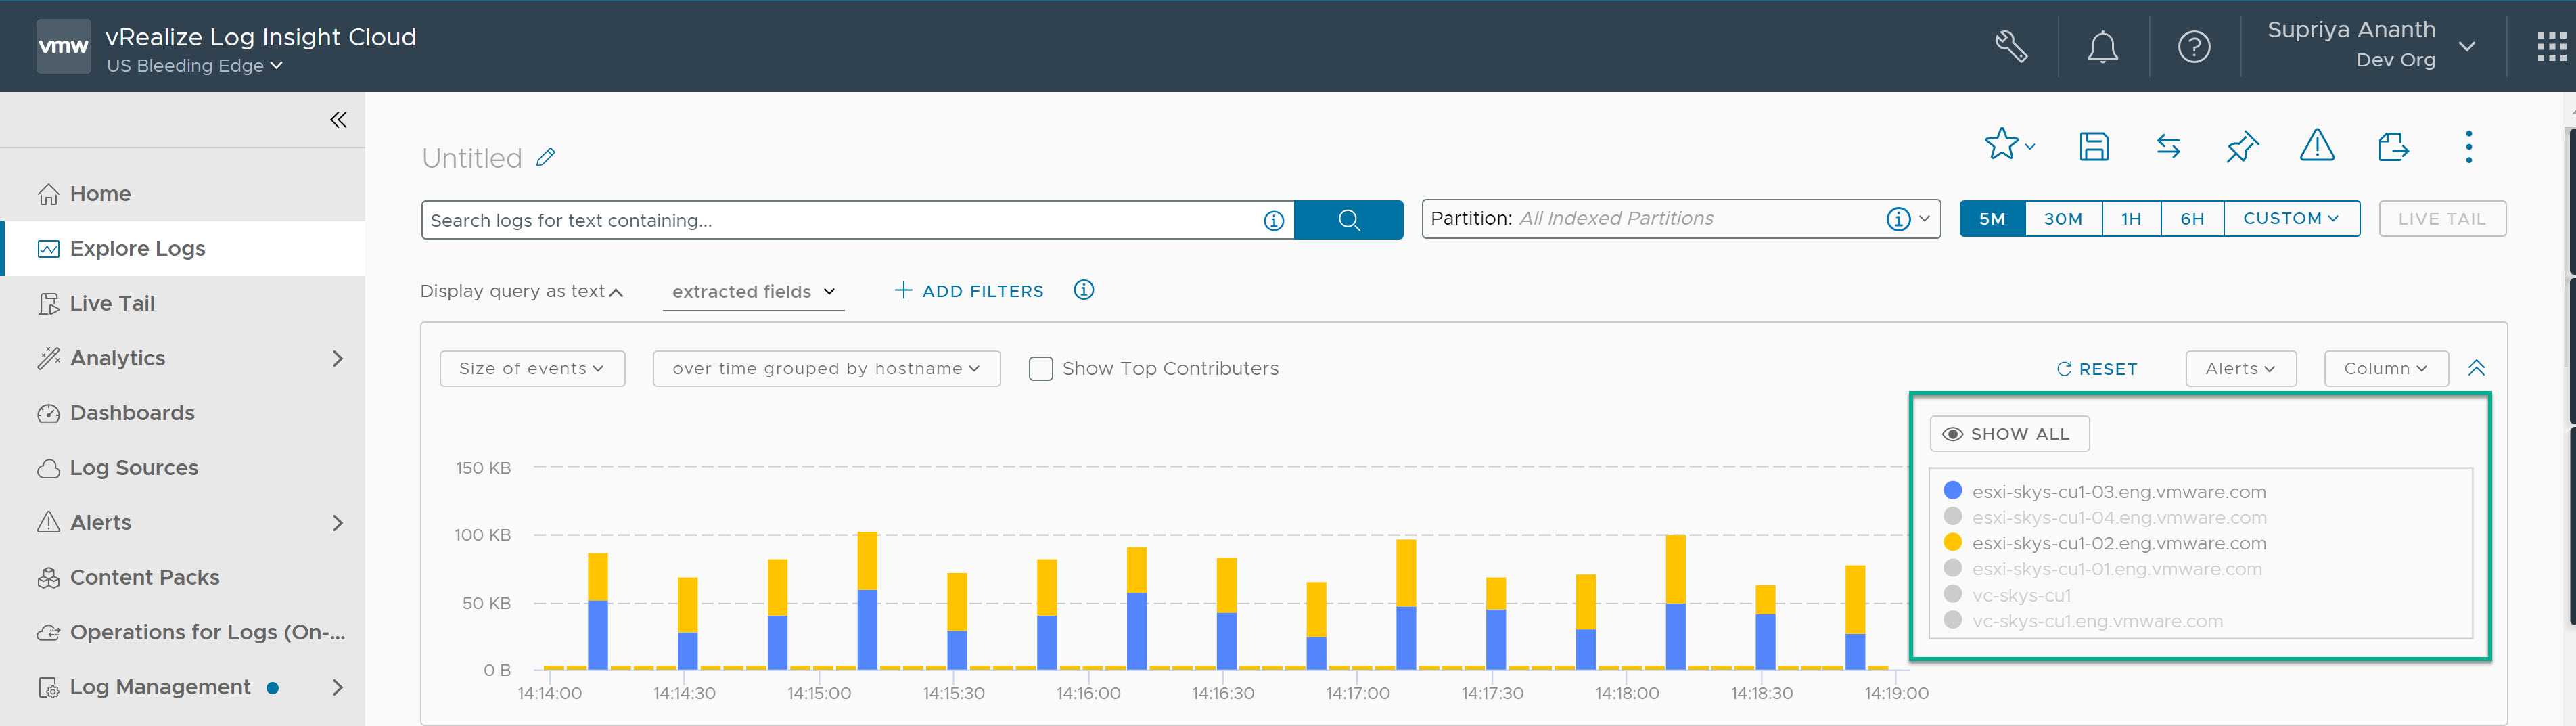
If you select the Time series option and group the log events by one or more fields in the Group by section, you see the legend for the selected field values at the far right corner of the chart. Use the legend to select or deselect one or more grouped field values.
You can also select the Hide All option on the top of the legend to deselect all grouped field values and manually select individual field values that you want to view on the chart.