


You can use these examples when building your queries in the Explore Logs page. The logs for the last five minutes are displayed by default. VMware Aria Operations for Logs (SaaS) indexes complete, alphanumeric, hyphen, and underscore characters.
Query for NSX-T Firewall Logs for a Firewall Rule ID in an SDDC
To query for NSX-T firewall logs for a rule ID in an SDDC:
- Define a filter.
- On the Explore Logs page, click Add Filter and select vmw_nsxtvmc_firewall_rule_id from the first drop-down menu.
- Select contains from the second drop-down menu.
- Enter the rule ID in the value text box.
- Click Add Filter and select sddc_id from the first drop-down menu.
- Select contains from the second drop-down menu.
- Enter the SDDC id in the value text box.
- Define the time range.
- Click the time range next to the Search button.
- Select a time range on the Relative to now or Relative to time tab or define a custom time range on the Custom range tab. You can also select a recently used time range on the Recently used tab.
- Click the Search button.
Query for AWS Audit Trail Logs for an AWS Account ID
To query for AWS audit logs for an AWS account ID:
- Define a filter.
- On the Explore Logs page, click Add Filter and select log_type from the first drop-down menu.
- Select contains from the second drop-down menu.
- Enter aws_cloud_trail in the value text box.
- Click Add Filter and select useridentityaccountid from the first drop-down menu.
- Select contains from the second drop-down menu.
- Enter the account ID in the value text box.
- Define the time range as explained in the first example.
- Click the Search button.
Query for Heartbeat Events Reported by the ESX/ESXi hostd Process
To query for all heartbeat events reported by the ESX/ESXi hostd process:
- Define a filter.
- On the Explore Logs page, click Add Filter and select appname from the first drop-down menu.
- Select contains from the second drop-down menu.
- Enter hostd in the value text box.
- Define the time range as explained in the first example.
- Click the Search button.
Query for Errors Reported by vCenter Server Tasks, Events, and Alarms
To query for all errors reported by vCenter Server tasks, events, and alarms:
- In the search text box of the Explore Logs page, enter error.
- Define a filter.
- Click Add Filter and select vc_event_type from the first drop-down menu.
- Select Exists from the second drop-down menu.
- Click the Search button.
Query to Monitor VMware vCenter User Login Activity in an On-Premises Partition
Note: To query logs in an On-Premises partition, you must have integrated
VMware Aria Operations for Logs with
VMware Aria Operations for Logs (SaaS). To learn more, see
Integrating VMware Aria Operations for Logs (SaaS) with VMware Aria Operations for Logs.
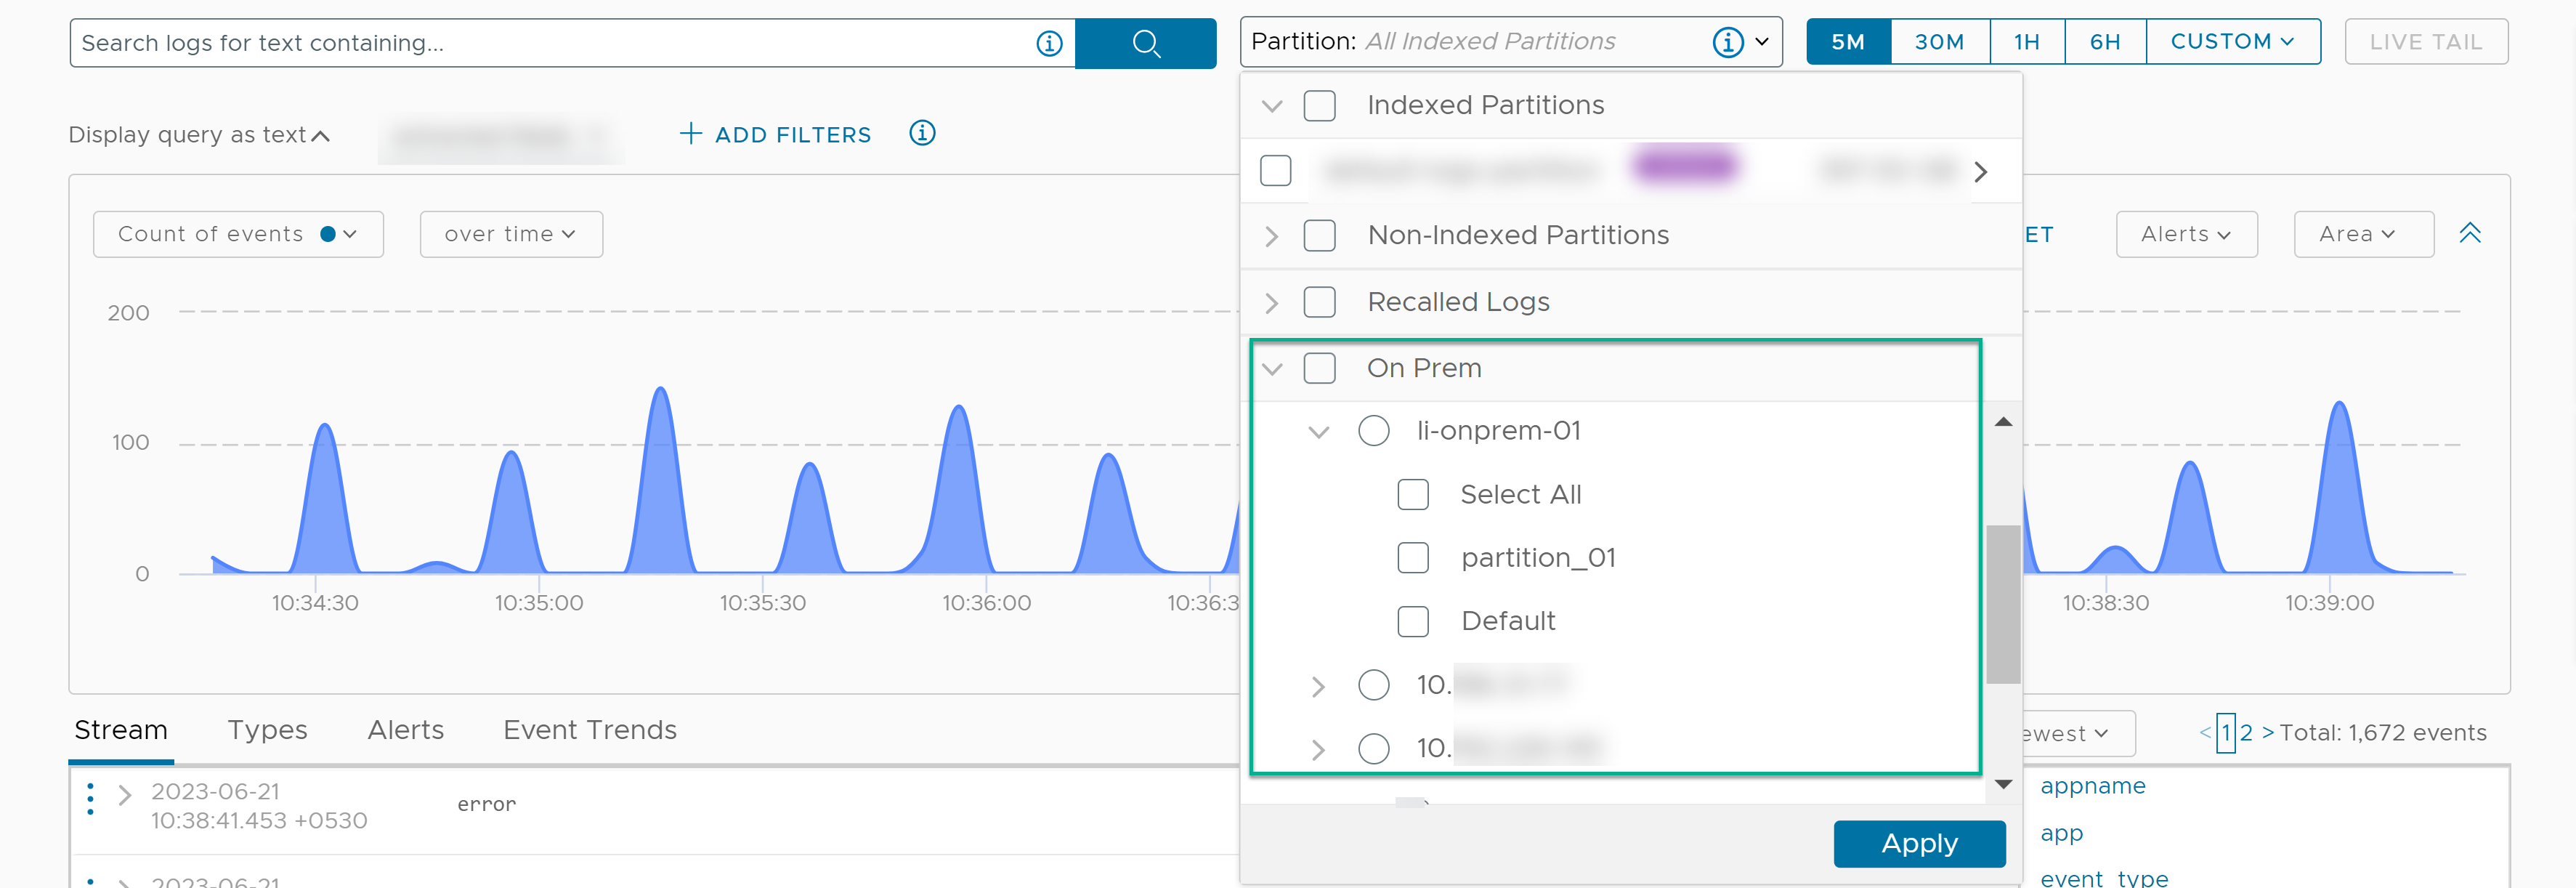
In the Partitions drop-down menu of the Explore Logs page, select one or more partitions of an on-premises cluster.
- Define a filter to identify logs containing vCenter Server.
- On the Explore Logs page, click Add Filter and select vc_username from the first drop-down menu.
- Select Exists from the second drop-down menu.
- Define another filter to identify login activities in the vCenter Server.
- Click Add Filter and select text from the first drop-down menu.
- Select Contains from the second drop-down menu.
- Enter logged in in the third drop-down menu.
- Click the Search button.
