


The SE analytics provides the insights into various performance metrics over a designated period.
The SE analytics comprises of the following sections:
For more information on metrics, see SE Metrics.
Chart Pane
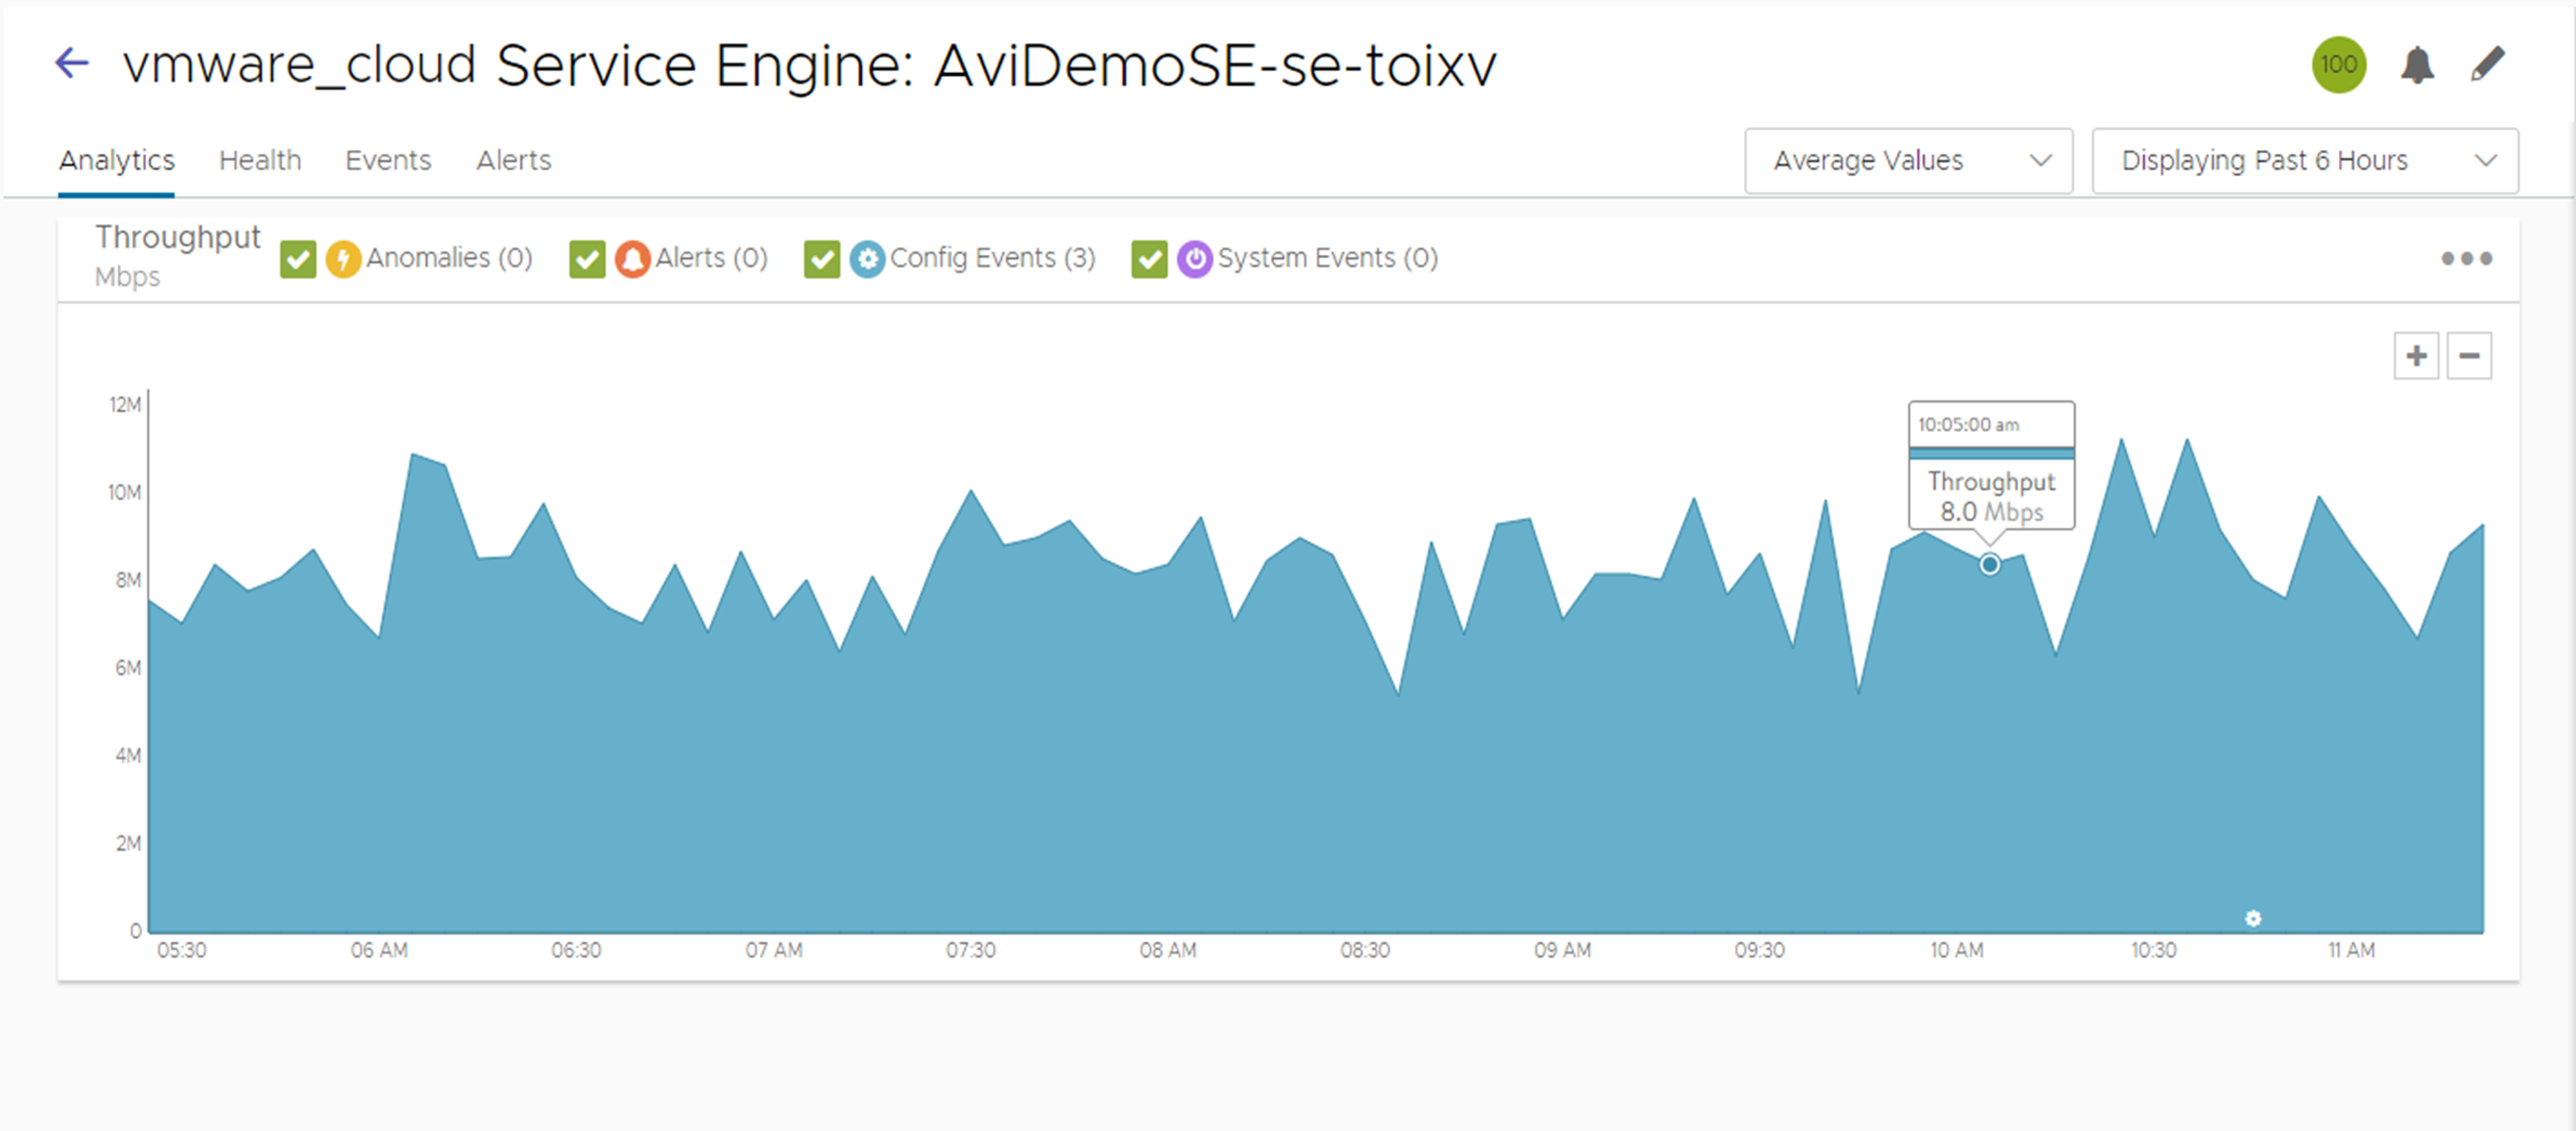
The chart pane displays a detailed historical chart of the selected Metric Tile for the current virtual service, pool, or SE. Point anywhere in the chart to display the results for that selected time in a pop-up window. Click within the chart to freeze the pop-up at that point in time. This helps to anchor a data point when the chart scrolls leftward with updates over time.
The radio buttons in the top right are used to customize the data that need to be excluded from the chart.
If you hover your mouse over the name of the SE, the following details are displayed:
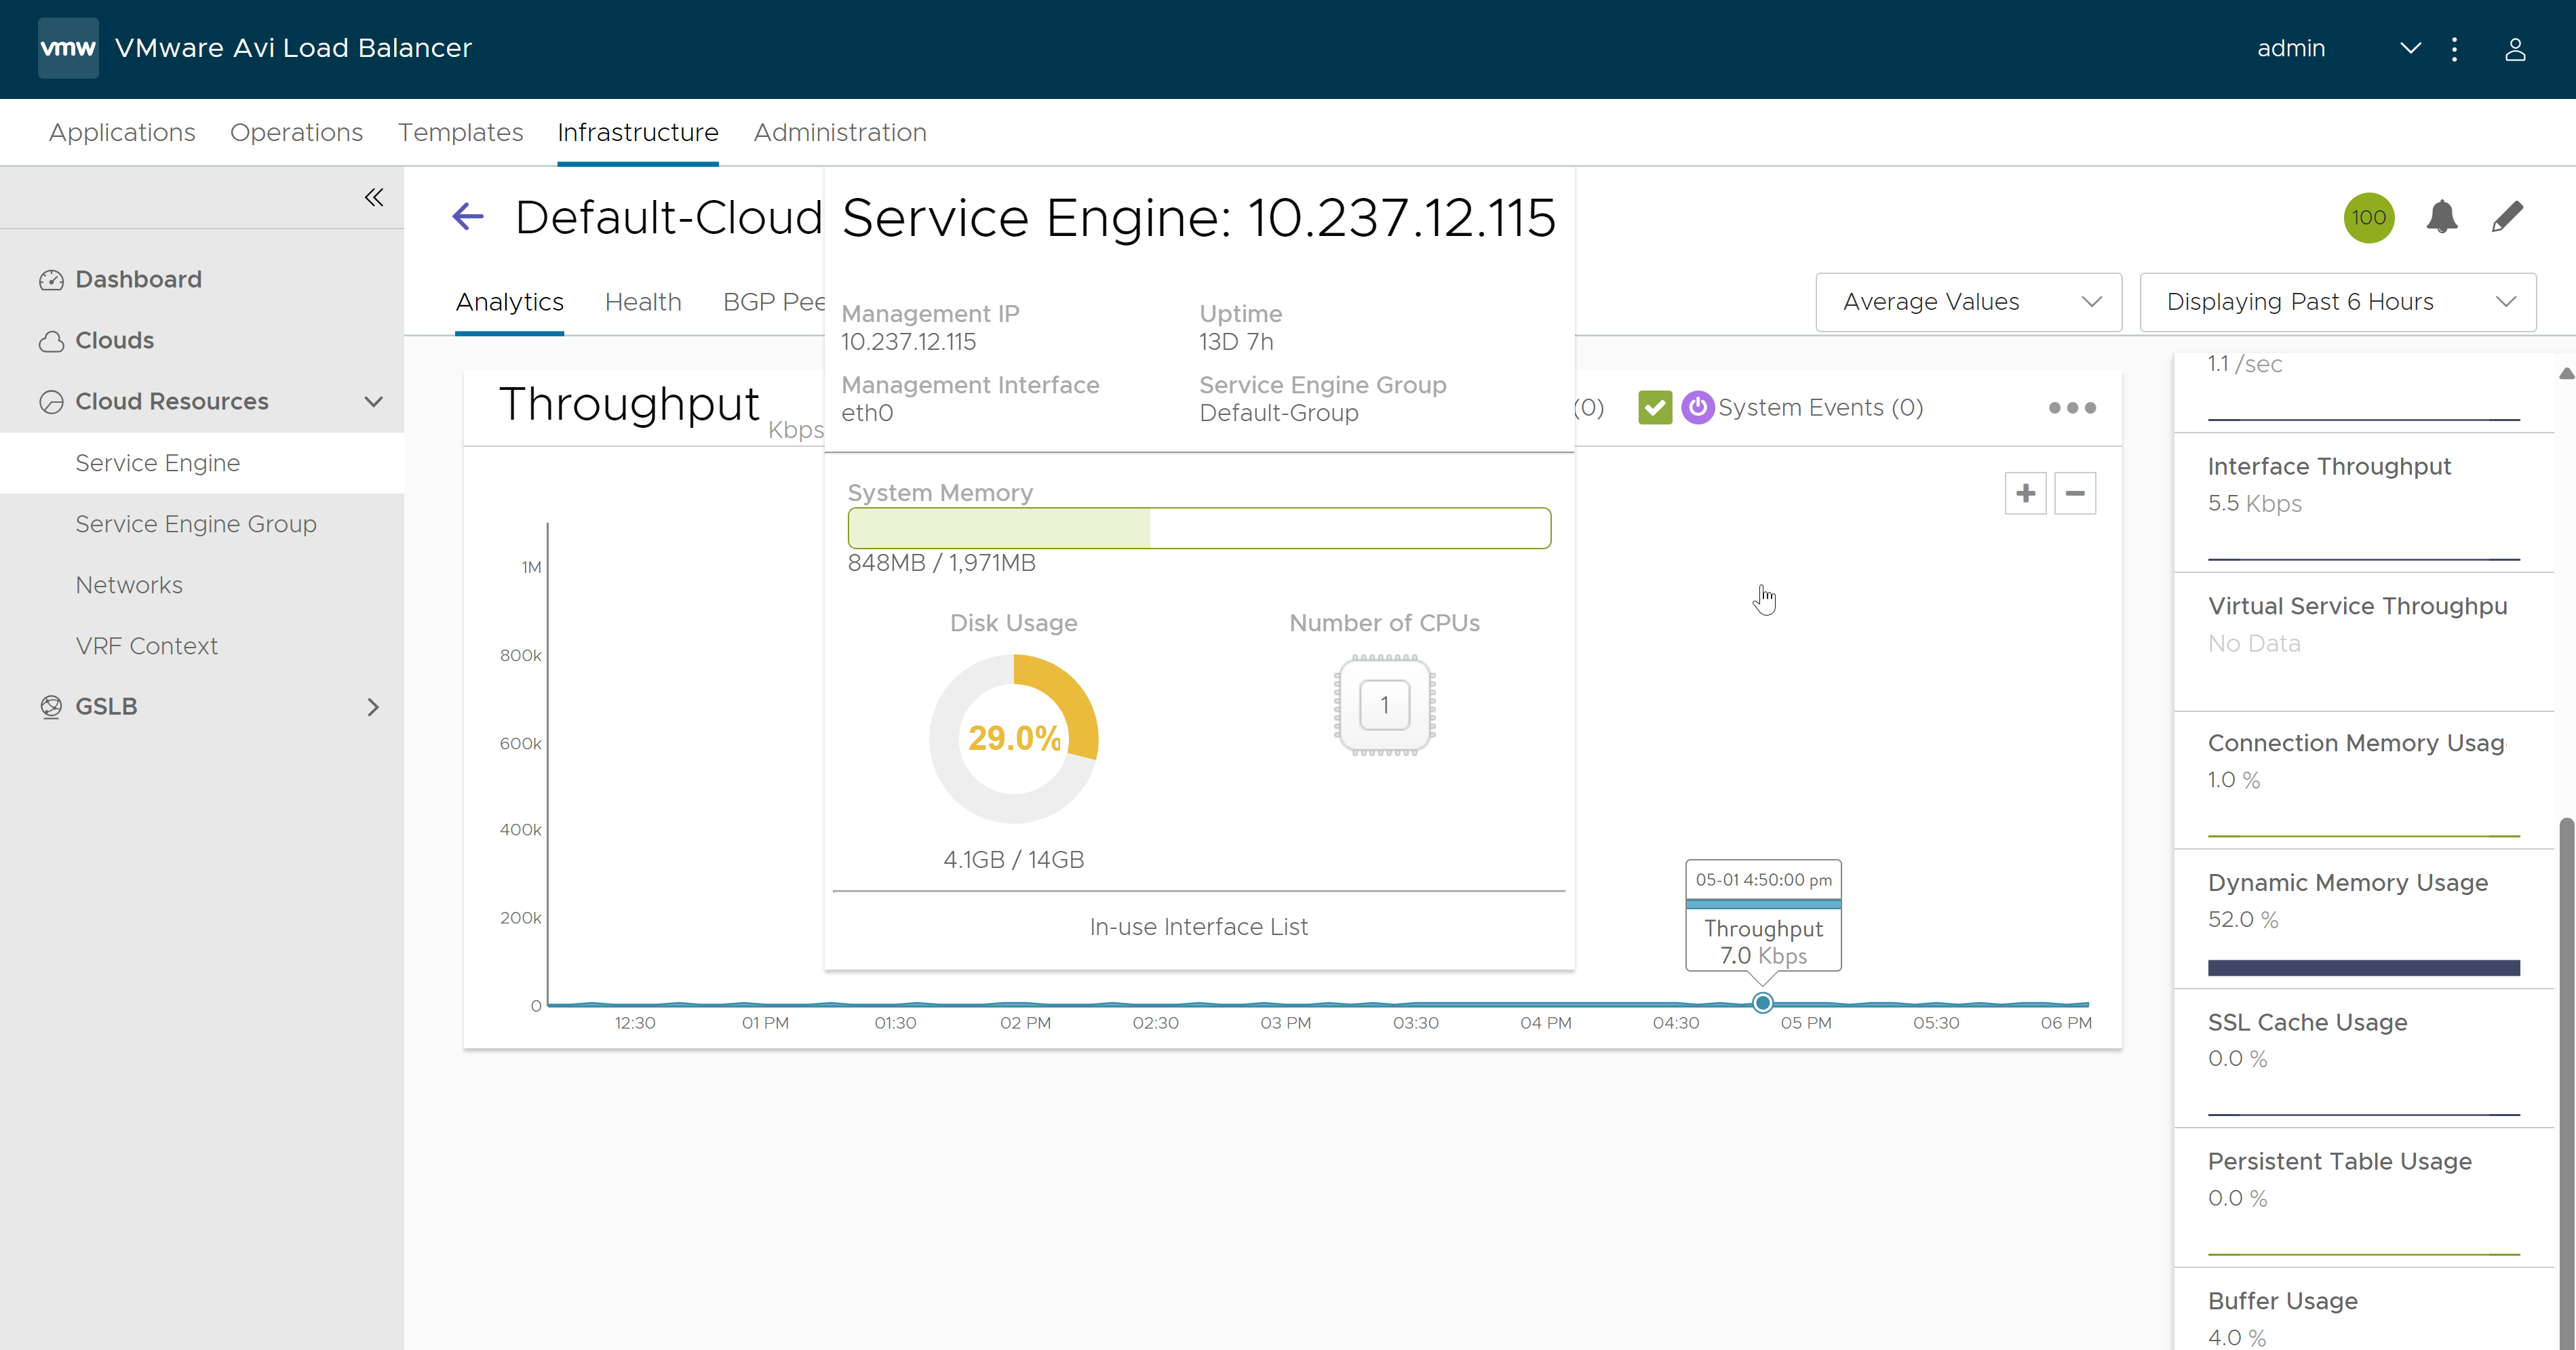
You can view the following details:
Management IP
Management Interface
Uptime
Service Engine Group
System Memory
Disk Usage
Number of CPUs
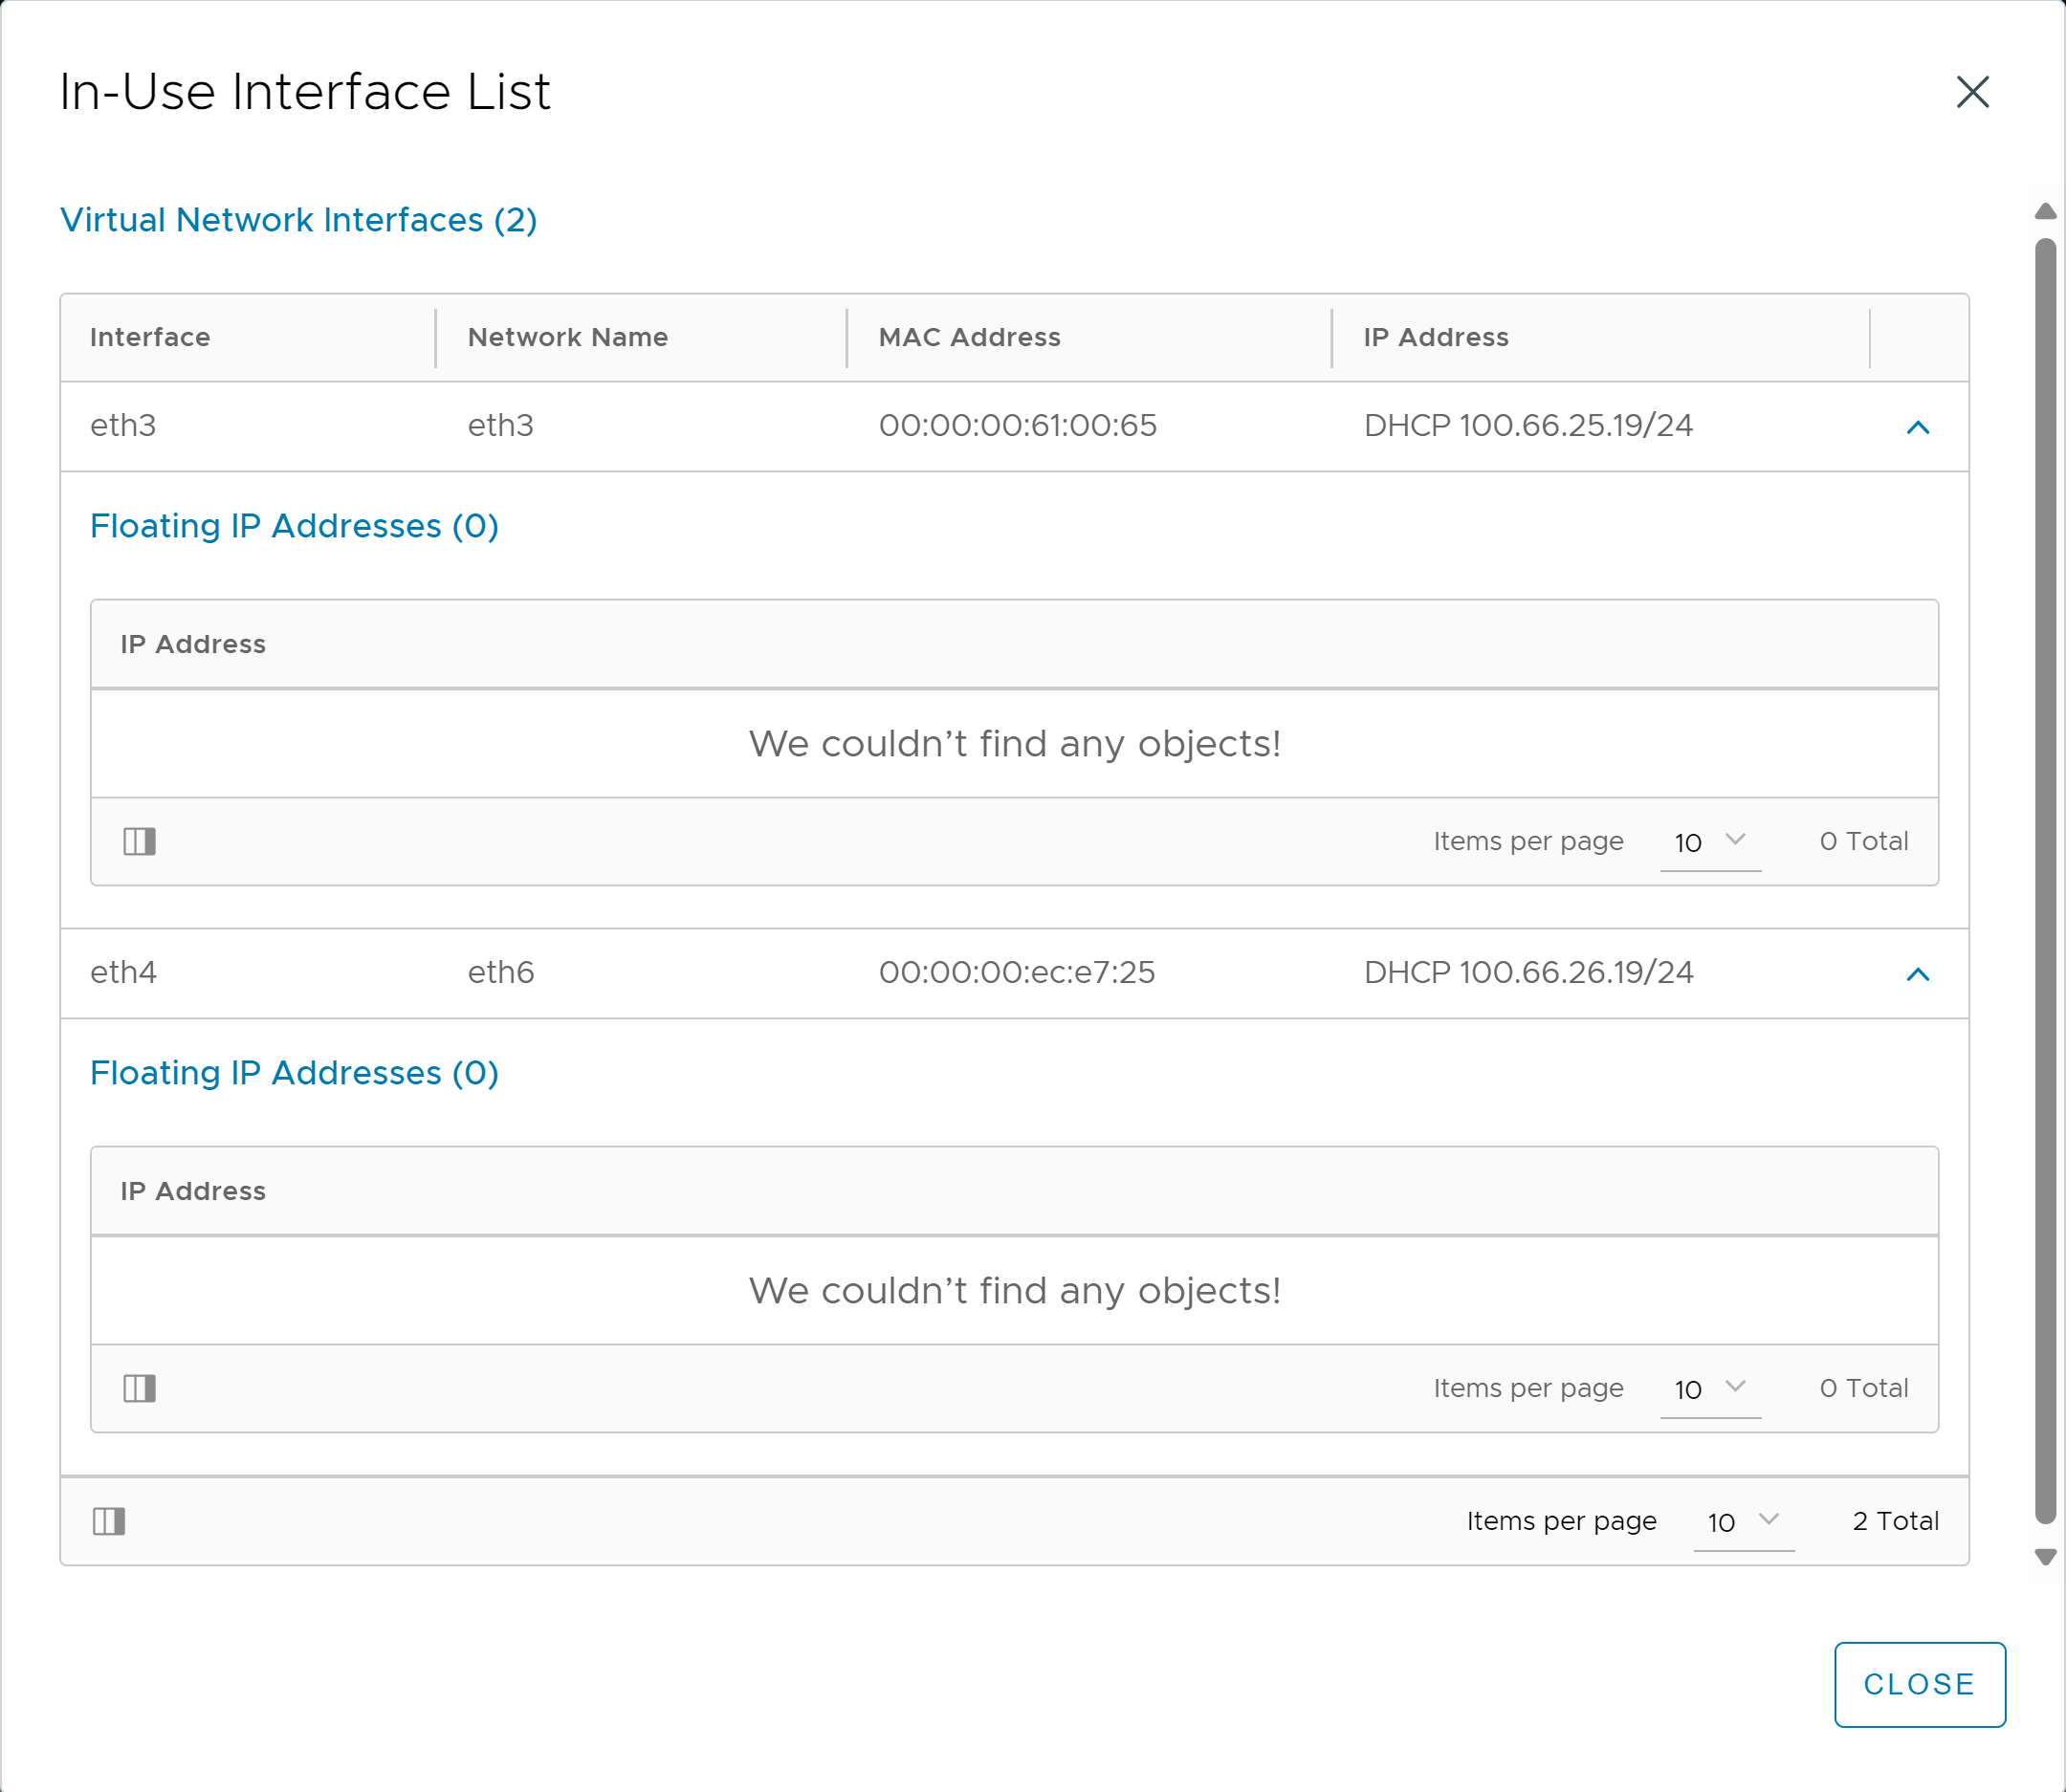
Click In-Use Interface List to view the following details:
Overlays Pane
The overlays pane allows you to overlay icons signifying important events within the timeline of the chart pane. This feature helps you correlate anomalies, alerts, configuration changes, and system events according to the changes in traffic patterns.
Clicking an Overlay button toggles the overlay items in the chart pane. Each overlay item lists the number of instances of that event type within the selected period. Clicking each overlay item will display additional data below the Overlay Item bar.

The items available in the overlay pane are:
Item Name |
Description |
|---|---|
Anomalies |
Display anomalous traffic events, such as a spike in server response time, with corresponding metrics collected during that period. |
Alerts |
Displays filtered system-level events that are critical enough to notify an administrator. |
Config Events |
Display configuration events which track configuration changes made to the Avi Load Balancer by an administrator or an automated process. |
System Events |
Display system events, which are raw data points or metrics of interest. System events can be noisy and are best used by alerts which filter and classify these raw events by severity. |
Anomalies Overlay
The Anomalies Overlay displays the periods of abnormal traffic detection based on its moving averages. Changing the time interval will provide greater granularity and potentially show more anomalies. Selecting the Anomalies Overlay check box displays yellow icons in the chart pane. Clicking on a yellow icon will display additional information related to that anomaly as shown below:
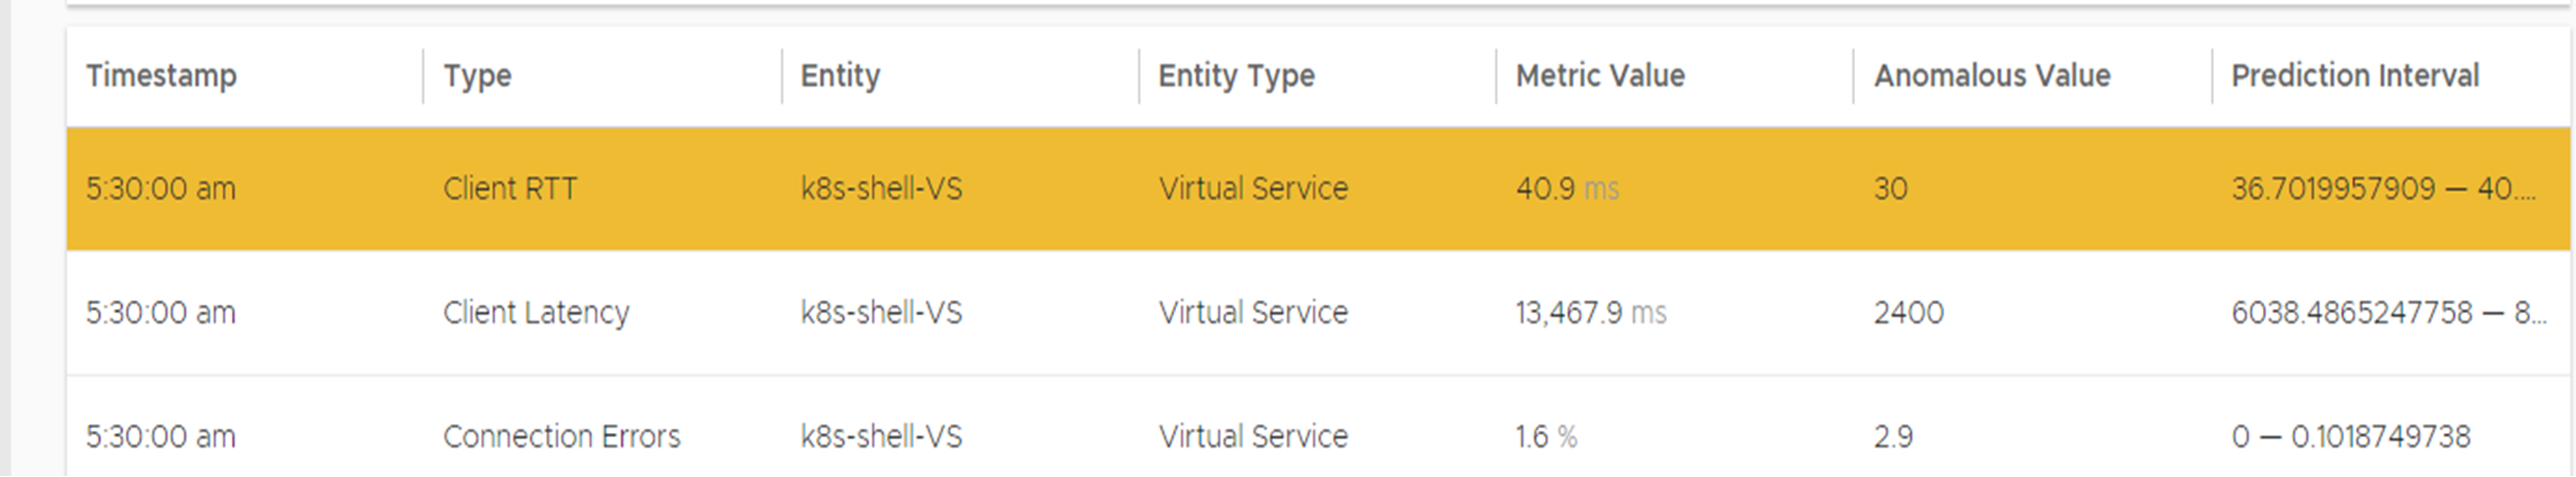
Name |
Description |
|---|---|
Timestamp |
Date and time when the anomaly was detected. It might either span the entire duration of the anomaly or merely be near the same time window. |
Type |
The specific metric deviates from the norm during the anomaly period. To be included, the metric deviation must be greater than 4 sigma. Numerous metrics, such as CPU utilization, bandwidth, or disk I/O might trigger anomalous events. |
Entity |
Name of the specific object that is reporting this metric. |
Entity Type |
Type of entity that caused the anomaly. This might be one of the following:
|
Metric Value |
The value of the metric. |
Anomalous Value |
Value of the anomaly. |
Prediction Interval |
An acceptable range for the metric. |
During times of abnormal traffic, the Avi Load Balancer records any deviations and provides insights into the root cause of the anomaly.
Anomalies are not recorded if the statistics interval is set to Real Time in the Displaying drop-down menu.
Alerts Overlay
Alerts Overlay displays the results of any events that meet the filtering criteria defined by . It notifies the administrators about critical information or changes to a site that requires immediate attention.
Alerts are transitory, as they will expire after a defined time. For instance, Avi Load Balancer might generate an alert if a server is down and then allow that alert to expire after a specified duration once the server is back up. The original event remains available for troubleshooting purposes later. Clicking the Alerts icon in the Overlay Items bar displays any red alerts in the chart pane. Selecting one of these chart alerts will display the below information under the Overlay Items bar:
Name |
Description |
|---|---|
Timestamp |
Indicates when the alert occurred. |
Resource Name |
Name of the object that is reporting the alert. |
Severity Level |
Determine whether additional notifications, such as sending an email to administrators or a log to Syslog servers, must be sent using the priority level. The three severity levels are:
|
Summary |
Briefly describes the event. |
Actions |
Dismiss the alert to remove it from the list and also remove the corresponding alert icon from the chart pane. Dismissing an alert here is the same as dismissing it through the bell icon at the top of the screen next to the health score or dismissing it using the Alerts tab. |
Edit |
Opens the alert filter configuration, which can be modified to make Avi Load Balancer more or less sensitive to generating new alerts. |
Expand/Contract |
Clicking the plus (+) or minus sign (-) for an alert either expands or contracts a sub-table showing more detail about the alert. This will typically show the original events that triggered the alert. |
Configuration Events Overlay
The Config Events overlay displays configuration events, such as changing the Avi Load Balancer configuration by adding, deleting, or modifying a pool, virtual service, SE, or an object related to the object being inspected. If traffic dropped off at precisely 10:00 a.m., and at that time an administrator made a change to the virtual services security settings, the cause of the change in traffic was due to the (mis)configuration.
Clicking the Config Events icon in the Overlay Items bar displays blue Config Event icons in the chart pane. Selecting one of these icons will display the following information below the Overlay Items bar:
Field Name |
Description |
|---|---|
Timestamp |
Date and time when the configuration change occurred. |
Event Type |
Always be scoped to configuration event types. |
Resource Name |
Name of the object that has been modified. |
Event Code |
There are three event codes:
|
Description |
Brief description of the event. |
+/- (Expand/Contract) |
Expands or contracts a sub-table showing additional detail about the event. When expanded, It shows a color-coded comparison of the previous configuration and the new configuration, as follows:
|
System Events Overlay
This overlay displays the system events relevant to the current object, such as a server changing status from UP to DOWN or the health score of a virtual service changing from 50 to 100.
Clicking the System Events icon in the Overlay Items bar displays System Event icons in the chart pane. Clicking any System Event icon in the chart pane displays a detailed table of information with the below columns:
Field Name |
Description |
|---|---|
Timestamp |
Date and time when the system even occurred. |
Resource Name |
Name of the object that triggered the event. |
Resource Type |
Type of resource involved, e.g., virtual service, pool, pool server, and so on. |
Event Code |
High-level definition of the event, such as |
Description |
Brief of the system event. |
+/- |
Expands or contracts the detailed information of an event. |
