There can be a difference in the CPU utilization figure reported by host monitoring tools and the actual CPU utilized by the Avi Load Balancer SEs. This disparity in CPU utilization is by design. This article explains the reason for the difference in values. You can also troubleshoot through the Avi Load Balancer UI and CLI modes.
Reasons for the Behavior
To minimize the end-to-end latency in the Avi Load Balancer SE, the CPU dispatcher cycle aggressively probes all the queues in the respective data path interface (Poll Mode Drivers (PMD)). This reflects as high CPU utilization on the underlying host OS, when the administrator issues the top or htop command.
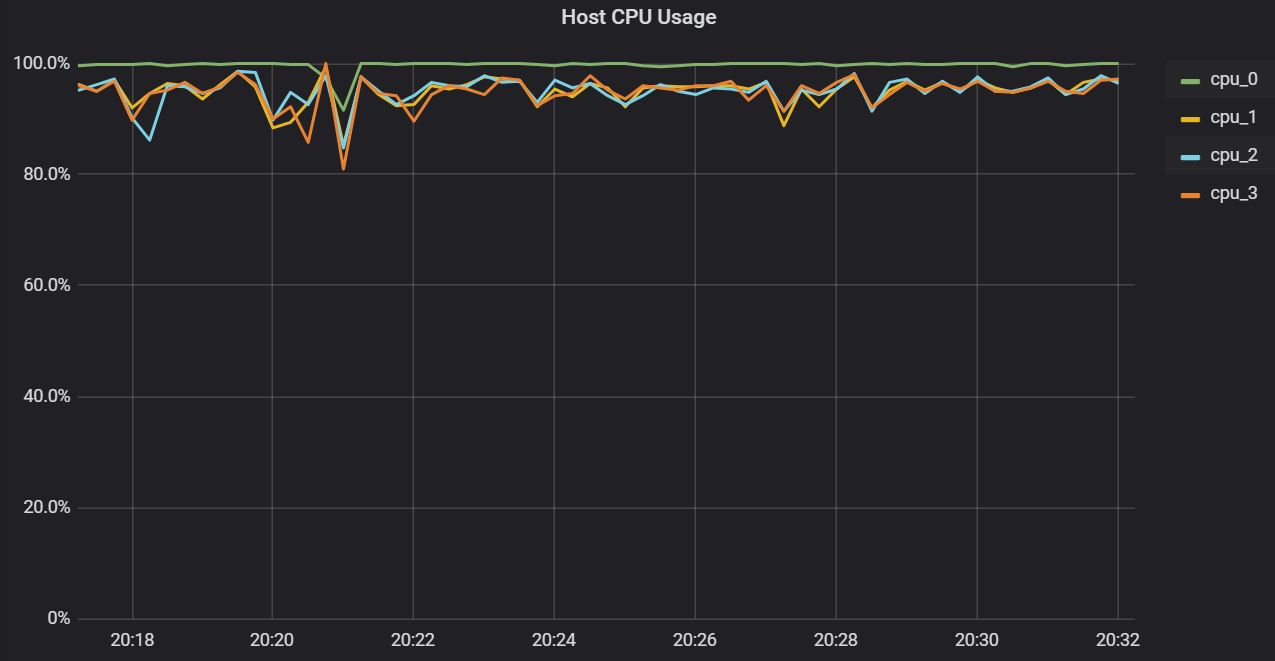
In this scenario, the monitoring tool of the underlying physical host shows that the actual CPU utilization was more than 95%, specifically vCPU0 and vCPU1, as shown below:

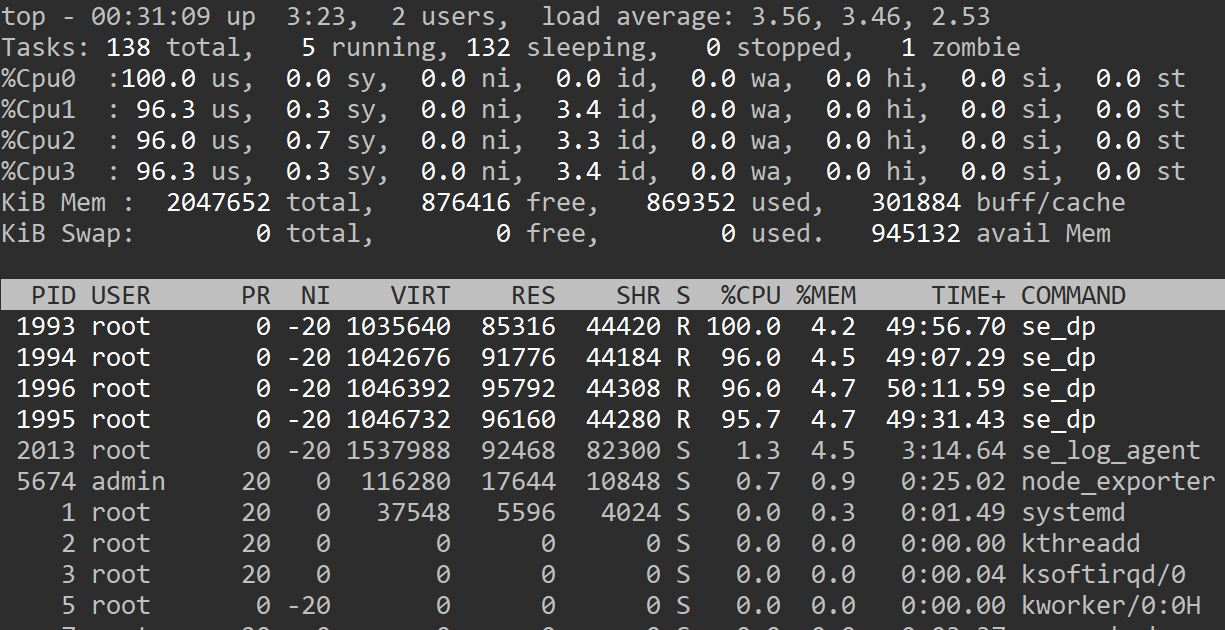
The corresponding real-time CPU stats from the physical host also show that the vCPU utilization is more than 95%, as shown below:

The Avi Load Balancer datapath is designed to scale in accordance with the number of available CPU cores. This is the reason for multiple se_dp (service engine data path) processes to be seen. The Avi Load Balancer tries to utilize all the CPU cores by running each se_dp process on all available CPU cores of the host or virtual machine to get maximum performance. This helps the Avi Load Balancer to scale with minimum locks and context switching in the user space, as each of these are different process contexts.
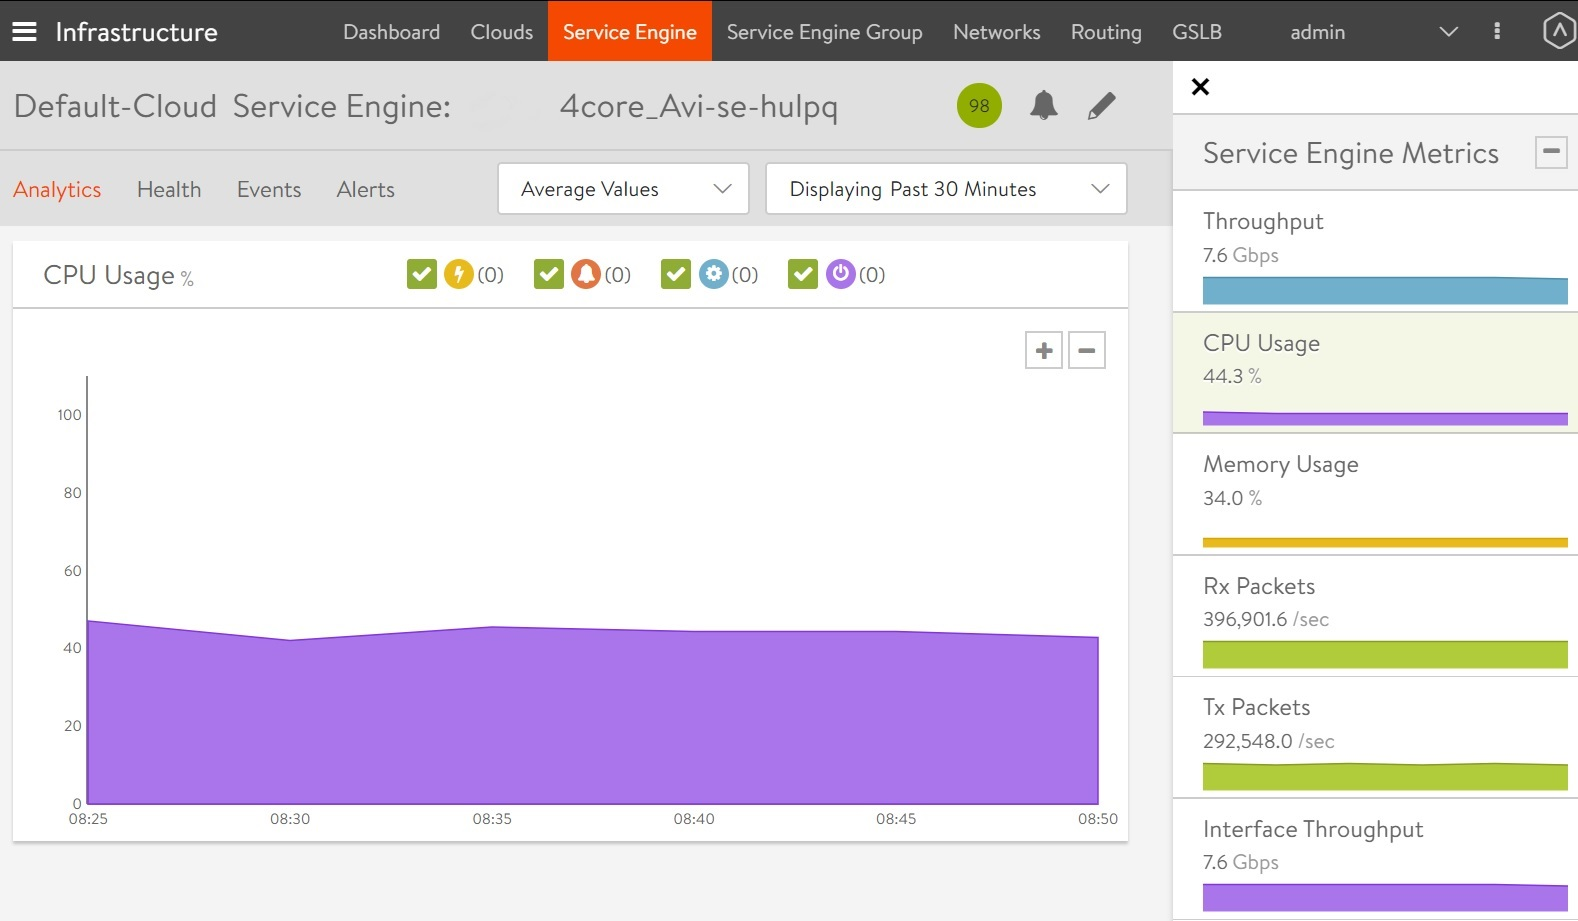
For the same period, the Avi Load Balancer Controller shows that the CPU usage is normal and not over-utilized as shown below:

The Avi Load Balancer SE Architecture
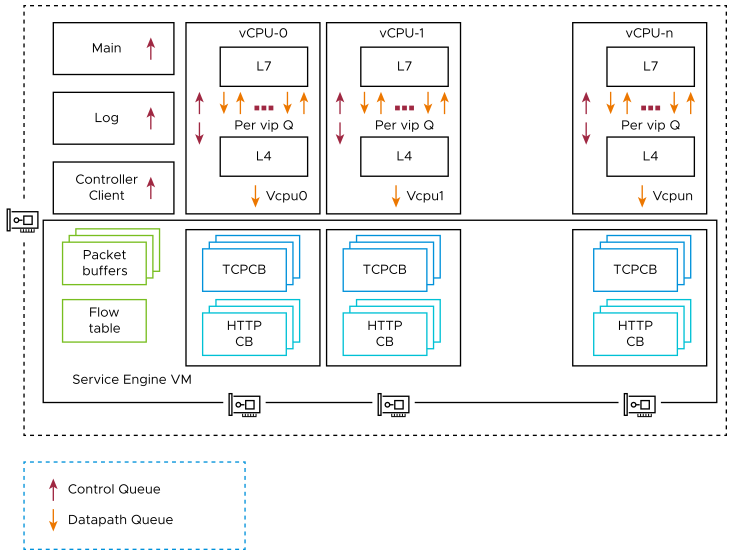
The Avi Load Balancer service engine container or virtual machine (VM) runs se_dp process per core to scale as per the number of CPU cores (not only within a host or VM but also across the SE VMs or hosts). The Avi Load Balancer SE vitual machine has underlying Linux processes running apart from the proprietary processes (like the se_dp process connectivity with the Controller), SE log agent (which reports the traffic logs to the Controller), and so on. The CPU utilization reported on the Linux host will be the consolidation of all the Linux processes and the Avi Load Balancer SE proprietary processes.

The accounting of the SE DP process utilization is done based on the number of ticks or cycles that the se_dp process spends in processing the packets and in no operation cycles (idle cycles). This accounting is done for each se_dp process respectively, in explicit statistics. To view this status, use show serviceengine *service engine name* cpu. Alternatively, you can view the statistics from the Avi Load Balancer UI (average of all se_dpprocesses).
Troubleshooting Using the Avi Load Balancer UI
The Avi Load Balancer user interface accurately shows the useful CPU available for processing and can be used as the source of proof for validating available CPU for an SE. As a best practice, utilization of CPU of an SE (as reported in the user interface) must not exceed 95%. The SE will likely be adding latency to network traffic when the CPU is running at very high levels.
For more information, see Reasons for Hypervisor Reporting High CPU Utilization by SE.
Troubleshooting Using the CLI
To view the actual CPU utilization for an SE (in the Avi Load Balancer shell), follow the steps below:
Login (using SSH) into the Controller and enter the shell prompt.
Look at the active SE under the current Controller using the command
show serviceengineas shown below:[admin]:> show serviceengine +-----------------------+---------------+-------------+----------+-------------+ | Name | SE Group | Mgmt IP | Cloud | Oper State | +-----------------------+---------------+-------------+----------+-------------+ | ****** |Default-Group |********* |********* | OPER_UP | +-----------------------+---------------+-------------+----------+-------------+
Find out the number of vCPU cores possessed by the physical host using the Iscpu command (requires sudo privileges), as shown below:
[root@se-linux-17 ~]# lscpu
Architecture:			x86_64
CPU op-mode(s):			32-bit, 64-bit
Byte Order:			Little Endian
CPU(s):				2
On-line CPU(s) list:		0,1
Thread(s) per core:		1
Core(s) per socket:		1
Socket(s):			2
NUMA noes(s):			1
Vendor ID:			GenuineIntel
CPU family:			6
Model:				85
Model name:			Intel(R) Xeon(R) Gold 6130 CPU @ 2.10GHz
Stepping:			4
CPU MHz:			2100.000
BogoMIPS:			4200.00
Hypervisor vendor:		VMware
Virtualization type:		full
L1d cache:			32K
L1i  cache:			32K
L2 cache:			1024K
L3 cache:			22528K
cat /proc/cpuinfo gives information per vCPU basis.
To view the actual CPU utilization of the chosen SE, use the command show serviceengine *SE_name*cpu as shown below:
[admin:]: > show serviceengine ***** cpu
+---------------------------+---------------------------------------+
| Field                     | Value                                 |
+---------------------------+---------------------------------------+
| se_uuid                   | se-*****-avitag-1                     |
|total_linux_cpu_utilization|25.3150057274                          |
|total_cpu_utilization      |0.006010782570367                      |
|total_memory               |3881336                                |
|free_memory                |399176                                 |
|idle_cpu                   |74.68499427726                         |
|process_cpu_utilization[1] |                                       |
|  process_name             |se_agent                               |
|  process_cpu_usage        |0.2                                    |
|  process_memory_usage     |1.59161690717                          |
|process_cpu_utilization[2] |                                       |
|  process_name             |se_dp0                                 |
|  process_cpu_usage        |0.0120356514073                        |
|  process_memory_usage     |5.67876628048                          |
|process_cpu_utilization[3] |                                       |
|  process_name             |se_dp1                                 |
|  process_cpu_memory_usage |0.0                                    |
|  process_memory_usage     |0.589796915289                         |
|process_cpu_utilization[4] |                                       |
|  process_name             |se_log_agent                           |
|  process_cpu_usage        |4.6                                    |
|  process_memory_usage     |1.00903400272                          |
|process_cpu_utilization[5] |                                       |
|  process_name             |se_hm                                  |
|  process_cpu_usage        |0.00344827586207                       |
|  process_memory_usage     |0.251872035814                         |
|process_cpu_utilization[6] |                                       |
|  process_name             |idle0                                  |
|  process_cpu_usage        |100.00                                 |
|  process_cpu_ewma         |99.9993500642                          |
|process_cpu_utilization[7] |                                       |
|  process_name             |1dle1                                  |
|  process_cpu_usage        |100.0                                  |
|  process_cpu_ewma         |99.998530399                           |
+---------------------------+---------------------------------------+
Field |
Description |
_process_name_ |
The name of actively running processes. |
_process_cpu_usage_ |
The amount of CPU utilized by the process as a percentage of total CPU usage (%) |
_process_memory_usage_ |
The amount of memory utilized by the process as a percentage of total memory usage (%). |
_total_linux_CPU_utilization_ |
The actual total CPU utilized by the underlay host OS. |
_total_memory_ |
The total amount of physical memory allocated to the VM or container. |
_free_memory_ |
The amount of memory that is currently free and not utilized by VM or container. |
_idle0_ and _idle1_ |
The amount of CPU idle for respective CPU. |
The example discussed is an output from the same host with two vCPUs. We have the list of grouping information like which process is running, the amount utilized for CPU, expressed as a percentage.
As two vCPUs are present, dispatcher processes like se_dp0 and se_dp1 corresponding to vCPU 0 and vCPU 1 respectively, are available.
Only the cores allocated to the container or the SE come up in the Avi Load Balancer SE CLI outputs.
The other vCPU cores which are part of the physical host are not included in the Avi Load Balancer SE CLI output.
The fields dispatcher_dp_cpu_util and proxy_dp_cpu_util are introduced to improve the granularity in reporting CPU utilization.
Suggestion for Service Stability
It is recommended to have hardware redundancy in terms of SE group autoscaling or redundant pool.
To enable options like TSO, RSS, and GRO, ensure that the respective hardware NICs are selected.
The Avi Load Balancer can manually configure the needed number of dispatchers and proxy cores along with the option to configure a dedicated dispatcher. In case of high throughputs, it is recommended to configure dedicated dispatcher.