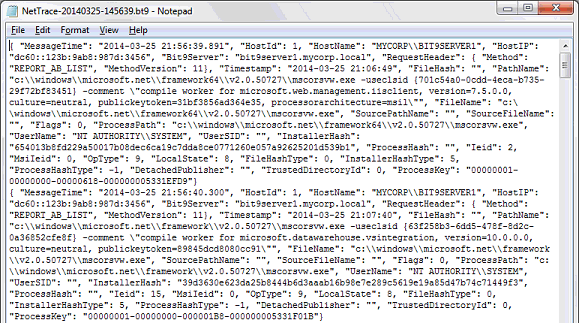
Data for external analytical tools is exported in JSON format. The JSON output from the Carbon Black App Control Server includes the field name with each value, making it easier both to view the raw output and to parse it later without creating indexing dependencies.

If you are using the Splunk App for Carbon Black App Control, Carbon Black App Control data imported by the Splunk Server is mapped to the CIM so that it can be integrated with other data. See Field Mappings to CIM in the Splunk App for App Control for details.
Depending upon which messages you enabled for export, one or more of the following files will appear in the Export Directory configured for External Analytics:
- Event Data –
EventTrace-<YYYYMMDD>.bt9 - File Catalog Data –
MetadataTrace-<YYYYMMDD>.bt9 - File Operations Data –
NetTrace-<YYYYMMDD-HHMMSS>.bt9
Each message log file will grow to a maximum of 512 megabytes, at which point a new log file will be created. New logs are also started when the Carbon Black App Control Server processes are restarted.
New File Operations data files (NetTrace) are named with both date and time as described above.
If two Event data or File Catalog data files are created on the same day, a number is appended to the second one of each. For example, the first file catalog data file created on October 29, 2023, would be named MetadataTrace-20131029.bt9. If that file reached its size limit that same day, the second file would be named MetadataTrace20131029-1.bt9.
Data Volume for Exported Analytics
This section describes data volume for exported analytics.
- 20KB per computer per day of file catalog
- 75KB per computer per day of events
- 135KB per computer per day of file operations (volume: High)
- 115KB per computer per day of file operations (volume: Medium)
- 100KB per computer per day of file operations (volume: Low)
Limiting Export Directory Size
This section describes how to limit the export directory size.
A checkbox on the console External Analytics tab of the System Configuration page allows you to limit the amount of data in the Export Directory. Checking this box displays a field in which you can enter the number of gigabytes of data to set as the maximum export directory size (i.e., the total size of all files in the Export Directory). When the limit is reached, files are deleted by age (oldest first) until the directory size is under the limit. The lowest allowable size limit is 3 GB. The current files in each category are never deleted. The upper limit is 10 petabytes.
Local vs. Network Log Files
When log files are local and the log content is relayed to the data analytics tool by a mechanism designed for that purpose, such as the Splunk Universal Forwarder, performance impact is expected to be minimal. However, if log files are written to a network location, there could be a delay in data availability if the network latency is high.
When analytics data is written locally, it is best to have it written to a disk other than the one on which the operating system or Carbon Black App Control SQL database are located.