To customize and save an event report as a Saved View, perform the following procedure.
Procedure
- In the console menu, click Reports > Events.
- If one of the existing reports in Saved Views is similar to the report you want, select it from the Saved Views menu. Otherwise, select (none).
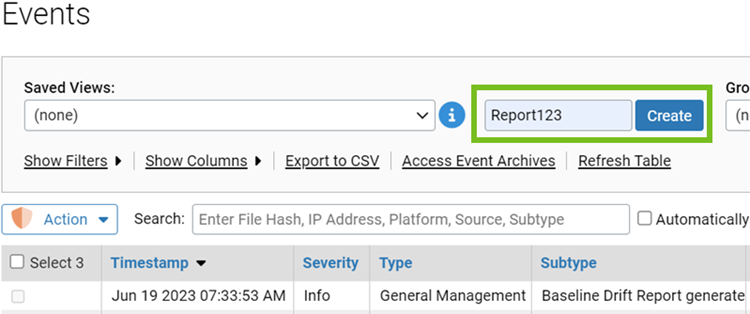
- Click the middle box in the Saved Views panel, type in a report name, and click Create. The new report now displays as the current Saved View and is added to the menu. (You also can wait until you have made all of your changes to create the new view.)
- Select filters to limit your results to certain values in specified fields. For example, you can have a report that only shows events whose Severity is Critical. You can specify filter fields and values in several ways:
- Click the Show Filters link, choose a field (column head), and specify the value you want to filter on.
- Click the funnel icon in a column head and fill in the value in the Filters dialog box.
- Click the funnel icon in a table cell to filter on that specific value.
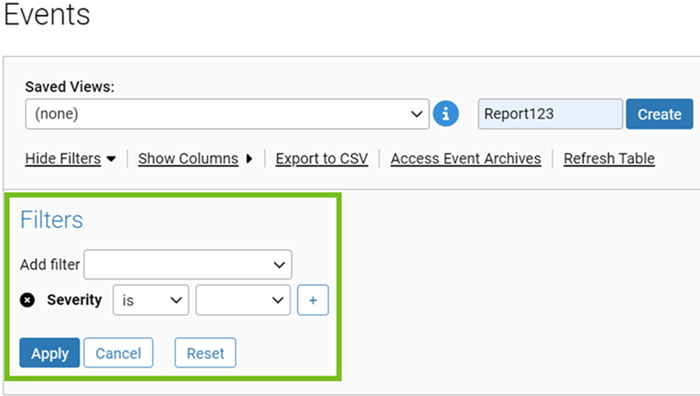
Click Apply when you are finished configuring filters.
- Click the Show Columns link and use the arrow buttons to define the types of data to display in your report, and the order in which the data types display. Click Apply when you are finished adding and removing columns.
- If you did not set the time range for your report during filter configuration, choose a time span from the Maximum Age menu.
- To set a different number of rows per page than is currently shown, use the Rows per Page dropdown menu in the bottom right of the page.
- To collapse data into an expandable group, use the Group by menus to select a group and sorting order (ascending or descending by alphabetical order or by the number of rows in each group). For example, if you Group by Policy, the Events page initially shows Policy names. You click the Policy name in the table to show the events for computers in that policy.
- To further organize the data into expandable subgroups, choose a group and sorting order in the Subgroup by menus.
- Make sure the report name is showing in the Saved Views menu and click the Save button in the Saved Views panel.