


All event reports available on your Carbon Black App Control Server, whether built in to Carbon Black App Control or created at your site, appear as Saved Views on the Events page.
The following table lists the predefined Saved Views and the events they include.
| Menu Choice |
Description |
|---|---|
| (none) |
Displays an unfiltered view of all Carbon Black App Control events during the selected time period, with default columns. |
| Alerts and Meters |
Displays a report that includes creation, modification, or deletion of alerts or meters, plus all activity that triggers an alert or increments a meter (during the selected time period). |
| Approval Requests |
Displays a report that includes each time an approval request for a blocked file is created (on an agent computer) and opened or closed (in the console). |
| Blocked Files (All) |
Displays a report that includes all files blocked for any reason (or that would have been blocked but are in Report Only state) during the selected time period. This includes files that are explicitly banned, files in an unapproved state that were blocked because of a particular computer’s Enforcement Level or policy, files that have not been analyzed yet, files on blocked devices, and files blocked because of custom rules. Actions blocked by registry or memory rules and certain built-in internal rules do not appear on this list. |
| Blocked Files (Banned) |
Displays a report that includes all files that have been blocked on computers running the agent during the selected time period due to an explicit ban on the file. |
| Blocked Files (Report Only) |
Displays a report that includes all files that would have been blocked during the selected time period but are in Report Only state due to the combination of policy settings and Enforcement Level for the computer executing them. |
| Blocked Files (Unapproved) |
Displays a report that includes all Unapproved files that have been blocked during the selected time period as a result of a policy’s Unapproved Executables or Unapproved Scripts setting and its applied Enforcement Level. |
| Carbon Black EDR |
When a Carbon Black EDR Server is integrated with a Carbon Black App Control Server, displays a report that includes all watchlist events from the Carbon Black EDR Server and status events from Carbon Black EDR sensors. |
| Computer Management |
Displays a report that includes the events for the selected time period related to computers running the agent, including:
|
| Connectors |
Displays a report that shows network security connector-related events, such as external notifications, malicious file detections, file analysis activity, and the addition, configuration, and removal of connector integrations. |
| Console Access |
Displays a report that includes user logins and logouts, and creation, editing, and deletion of console login accounts during the selected time period. |
| Device Control |
Displays a report that includes device-related events during the selected time period. These events include approving, banning or removing approvals or bans on devices, detection of a new device on the network, detection of attachment or detachment of a device on the network, and any device access covered by device-related policy settings. See Managing Devices for information about devices controlled by these features. |
| Duplicate Computer Registrations |
Displays a report that includes all events involving attempts to register more than one computer under the same agent id. |
| File Analysis |
Displays a report that includes all events related to file analysis by external tools. This includes external notifications, file upload events, and reports of malicious or potential risk files from Carbon Black File Reputation or third-party tools. |
| Memory |
Displays a report that includes all events related to memory (process protection) rules. Memory rules affect Windows systems only. |
| New Files (All) |
Displays a report that includes all new files (that is, not previously in the File Catalog) that have appeared on computers at your site during the selected time period. |
| New Files (Approved) |
Displays a report of all files approved because of various reasons during the selected period. Does not include files approved because of initialization. |
| New Files (Banned) |
Displays a list of all new banned files seen on the network. |
| New Files (Unapproved) |
Displays a report that includes all new files that have appeared on the server during the selected time period and have not been approved or banned. |
| New Installations |
Displays a report that includes each instance in which a file writes one or more files (creating a new file group) during the selected time period. Includes Windows installations only. |
| Registry |
Displays a report that includes all events related to Windows Registry rules. Registry rules are applicable to Windows computers only. |
| Reputation |
Displays a report that includes all reputation-related events, including adding or deleting a file or publisher approval based on reputation, or changes to file or publisher reputation properties. |
| Security Alert Events |
Displays a report of security-alert-related events. Events include agent computers unprotected by Carbon Black App Control because of upgrade failures, detection or prevention of agent tampering, and a computer clock out of sync (potentially set back to attempt to defeat security measures.). |
| Server Management |
Displays a report that includes any modifications to data on the System Configuration pages, data related to Carbon Black App Control database backup (success, failure, changes), server errors, Carbon Black File Reputation errors, database errors, and startup or shutdown of the Carbon Black App Control Server (during the selected time period). |
| System Health History |
Displays a report that includes any changes in the severity of a health indicator as well as any creation, modification or deletion of health indicators. |
| Temporary Policy Overrides |
Displays a report that includes each time a temporary policy override code is generated for an agent. |
| Threat Indicators |
Displays threats detected by the ATIs in the Indicator Sets on agent-managed computers. If no Indicator Sets are activated, this view is empty. See Advanced Threat Detection for more information about this and other threat-related event views. |
| Threat Indicators - Legacy |
Displays threats detected by the ATIs that were installed in releases prior to v7.2.0. If you did not install the Detection Enhancement in a prior release, this view is empty. |
| Threat Report - Suspicious Executable Created by Shell |
Displays events in which certain executable files are created by cmd.exe or powershell.exe in locations such as the system directory, Recycle Bin, or AppData. |
| Threat Report - Suspicious Files by Location |
Displays events in which a file is first seen or executed on any computer, or first appears (unapproved) on at least one computer, in an unusual, suspicious location. An example would be unexpected file activity in the Recycle Bin. |
| Threat Report - Suspicious Files by Name |
Displays events in which a file is first seen or executed on any computer, or first appears (unapproved) on at least one computer, with a suspicious name, often a name that appears similar to the name of a legitimate Windows file. For example, discovery of a file named svch0st.exe (using a zero in place of the lowercase o in svchost.exe) would display in this event view. |
| Threat Report - Suspicious Files by Parent |
Displays events in which an unknown, or low prevalence, executable file is written by a program that should not normally be creating such files. An example of this is an executable file created by Adobe Reader; this is often indicative of a malformed- or malicious-PDF-style attack. |
| Unified events |
Displays events for which the source is a Unified Management server. See Unified Management of Multiple Servers for more information about these events. |
To view an existing event report:
-
On the console menu, choose Reports > Events. The Events page appears with the default view showing all events in the past hour:
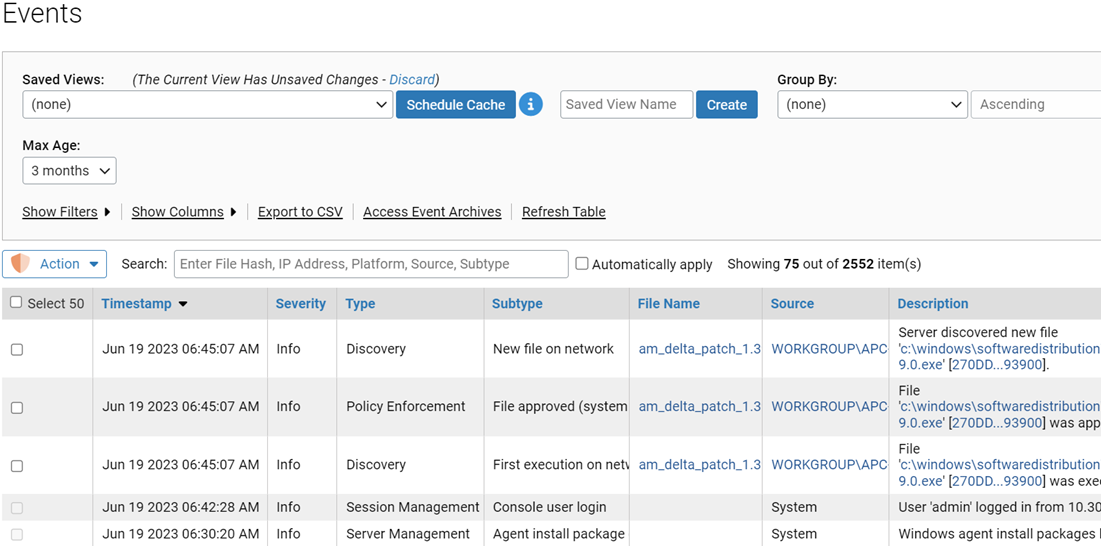
- Select a view from the Saved Views menu. The view appears. For views with many, and in some cases, wide columns, you might need to scroll left and right to see all the data for an event.
See Customizing Event Reports for details about changing and saving reports.
- You can download event tables in CSV format.
- If an IP address is listed in an event table or description, it is the IP address of the agent computer at the time the event was reported, which is not necessarily the current IP address.
