


The portlets on a dashboard display file, computer, or event information. They can show the number and types of computers managed by Carbon Black App Control Agents, the number and type of security policies enforced, or the categories of software on your computers.
The dashboard can also include portlets that let you make inquiries such as finding an event or file, or portlets that take actions such as locking down all computers.
Each portlet has a toolbar with its name in the top left and a series of buttons in the top right. The main content of the portlet is below the toolbar. Data is displayed in this content area in the form of tables, charts, graphs, RSS crawls, or HTML pages. For portlets that take action or allow queries, there are fields to fill in or buttons to click to execute an action. You can also add portlets.
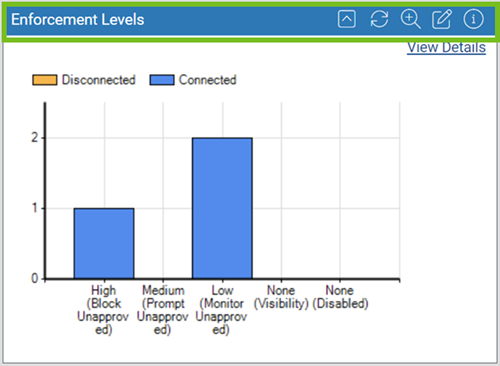
In many portlets, moving the mouse cursor over an element of a chart, for example, a bar in a bar chart, provides a description of that element, such as how many computers are represented by a particular bar in the chart.
Special Portlet Controls
Portlets can have special controls that provide more information or take an action. For example, the Emergency Lockdown portlet has large buttons for Lockdown and Restore. The Alerts portlet has highlighted text links for resetting some or all links. Where there are special controls, text in the portlet itself describes their purpose.
