The Endpoints page in the console displays sensor status and details.
The Endpoints tab on the Endpoints page, displays all deployed sensors by default.
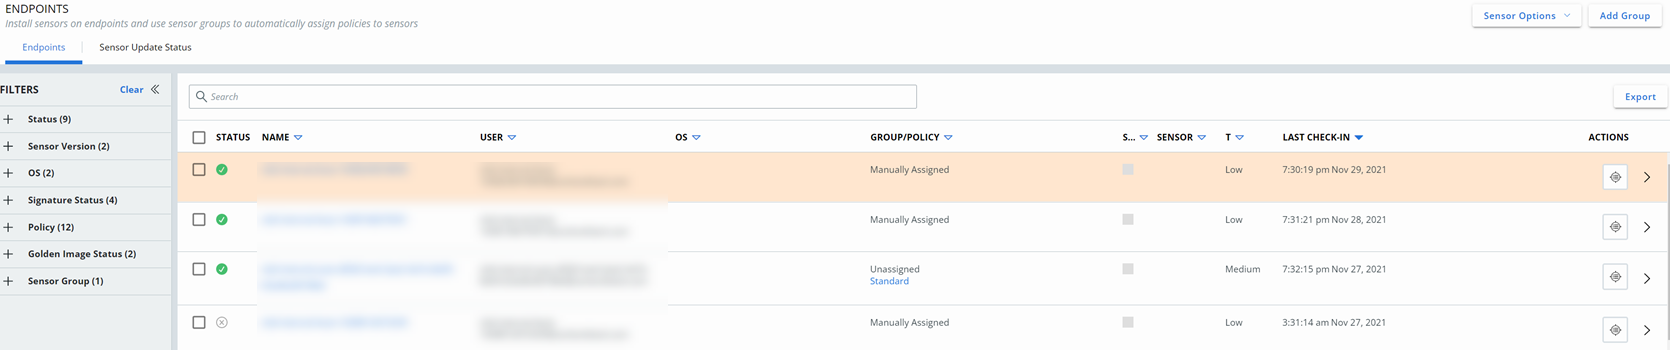
You can limit which sensors to display by using the Filters options in the left pane. See Sensor Filters.
To export the table data into a CSV file, click the Export button in the upper right section of the page.
You can define which columns display in the results table. Click Configure Table at the bottom of the page to hide or display columns.
The resulting sensor data displays in the following columns by default:
Status
The Status column indicates the state of a sensor and any administrator actions that have been taken on the sensor. This column can contain multiple icons to indicate the sensor state.
| Icon | Status | Description |
|---|---|---|
 |
Active | Sensor has checked in within the last 30 days. |
 |
Bypass | Sensor has been put into Bypass mode by an administrator. All policy enforcement on the device is disabled and the sensor does not send data to the cloud. Sensors also enter Bypass mode briefly during a sensor update. See Bypass Reasons. |
 |
Deregistered | Sensor has been deregistered or uninstalled; it will persist on the Endpoints page in this state until it is removed. |
 |
Errors | Sensor is reporting errors. |
 |
Inactive | Sensor has not checked in within the last 30 days. |
 |
Pending install | Sensor has not been installed following an installation request email sent to a user. |
| No icon | Pending update | Sensor is pending an update. |
 |
Quarantine | Sensor has been put into Quarantine mode. It is isolated from the network to mitigate the spread of potentially malicious activity.
Note: Quarantine is not supported for Linux sensors before version 2.13.
|
| No icon | Sensor out of date | Sensor is not using the current available sensor release version and is eligible for update. |
Name
The Name column represents the Device ID of the endpoint.
User
The User column displays user data based on the OS and the sensor version.
-
macOS 3.3.2+ versions display the last active user logged in to the device.
-
Windows 3.5+ versions display the last active user logged in every 8 hours; if there is no interactive user logged in within the 8 hour window, a noninteractive user name can appear.
-
Previous macOS and Windows versions display the user who installed the sensor.
-
Linux versions are intentionally left blank because multiple, simultaneous logged-in users and desktop users are possible.
OS
The OS column lists the operating system that is running on the endpoint.
Group/Policy
The Group/Policy column lists the group to which the sensor belongs (if any), how its policy was assigned, and the name of the assigned policy. If a sensor is not a member of a sensor group and was manually assigned a policy, it is listed as Manually assigned. If the sensor metadata does not match any group criteria, it is listed as Unassigned.
Signature
The Signature column displays an icon that represents the status of each sensor signature version.
| Signature Status | Icon | Description |
|---|---|---|
| Up to date |  |
Signature version is current. The installed signature version was released within 7 days of the current date. |
| Out of date |  |
Signature version is out of date. The installed signature version has not been released within 7 days of the current date. |
| Not Available |  |
Signature version is not yet reported or is unidentifiable. Signatures can display as not reported if the local scan is not configured or if the sensor encountered an error after the local scan was configured. |
| Not Applicable | No icon | Unidentifiable sensor signature version. This presents for macOS and Linux sensors. |
Sensor
The Sensor column lists the sensor version that is running on the endpoint.
Target
The Target column lists the target value of the endpoint. This value can be Critical, High, Medium, or Low.
Last Check-in
The Last Check-in column displays the last time and date that the sensor checked in with the Cloud.
Actions
The Actions column provides two actions that you can perform on the endpoint.
Click the  icon to investigate any events that have occurred on the endpoint.
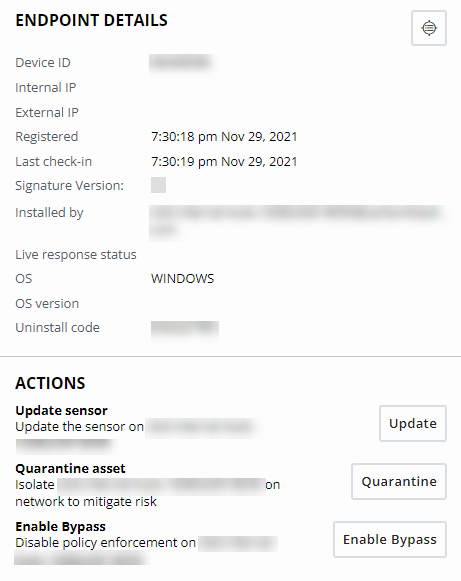
Click the > icon to open an Endpoint Details pane that provides more details about the selected endpoint.