


After you retrieve XDR data, you can explore the data on the Alert Triage page.
Note: For instructions on retrieving XDR alert data, see
Retrieve XDR Data on the Alerts Page.
On the left navigation pane, click
Alerts and then click the
Alert Triage
 icon next to the item of interest.
The Alert Triage diagram displays network nodes (domain or IP) that highlight IDS-specific network connections.
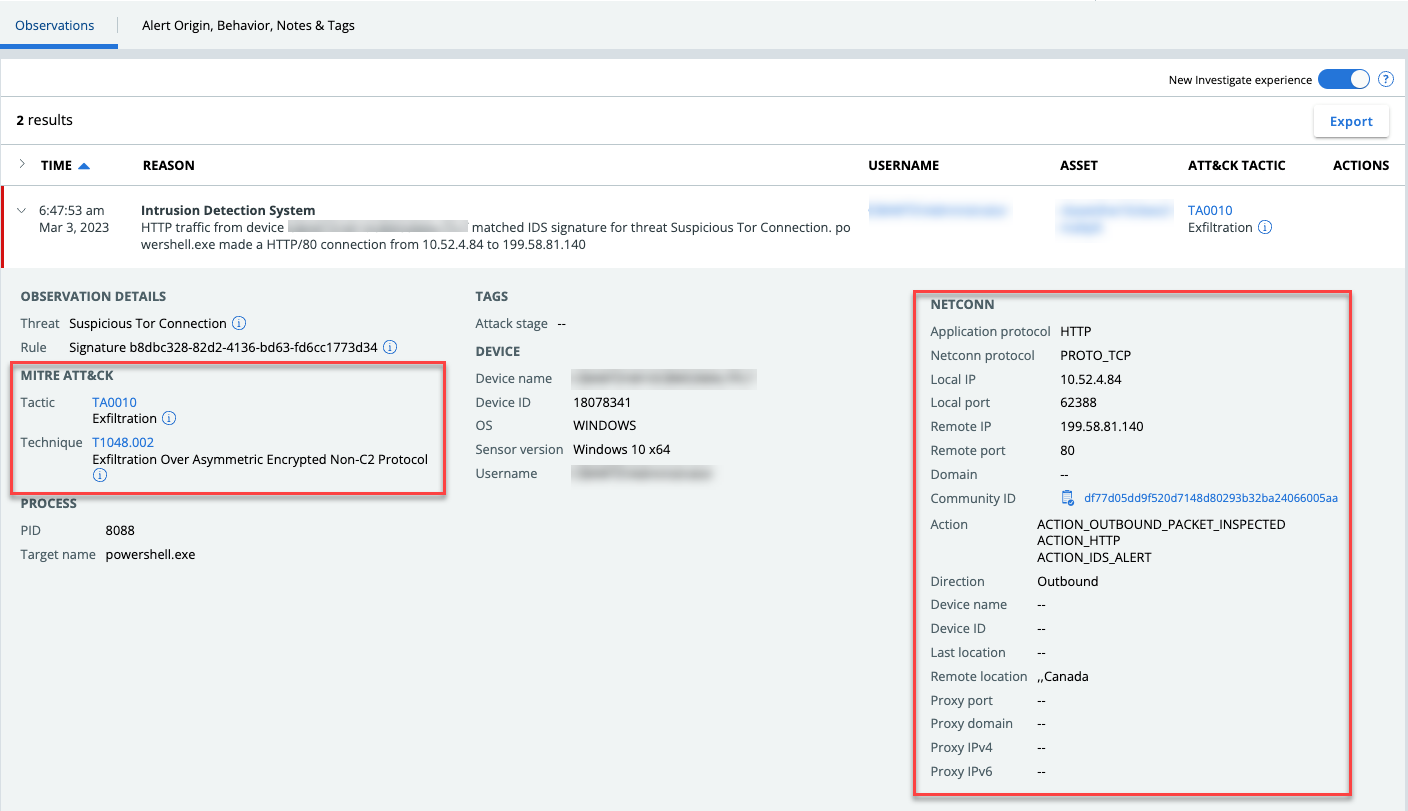
In the bottom pane, select the Observations tab to view the following fields:
- Time that the observation occurred
- Reason for the observation. This is a more detailed view than was previously available with Enriched Events.
- Username who executed the process that triggered the observation
- Asset
- ATT&CK Tactic & Technique
- Available Actions
MITRE ATT&CK tactics and techniques and other netconn data display in the Observations Details pane that opens when you expand the alert.
Note: For general information about the Alert Triage page, see
Visualizing Alerts.
