


You can access a visualization or process tree of your alerts.
On the Alerts page, click the Alert Triage  icon next to the item of interest. The Alert Triage page opens.
Each event in the attack stream (process, file, or network connection) is shown in the process tree as a node. The attack origin displays on the left and each subsequent event is shown from left to right as the attack progressed.
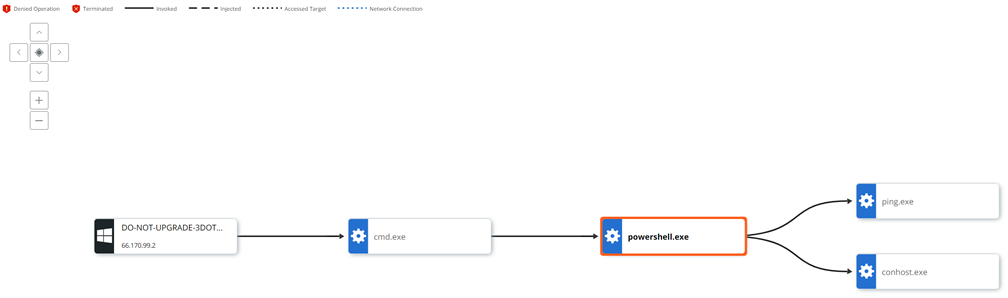
You can zoom in and out or pan your view of the image using the navigation buttons in the upper left of the page. You can investigate or close the alert using the respective buttons in the upper right of the page. Use the UP and DOWN arrows in the upper right to traverse between alerts.
Node Types
-
Operating System/Root Node: The root node at the far left of the process tree represents the host device on which the original activity took place. The root node icon represents the operating system that was running on the device.
-
Gears/Processes: Processes that have run or are still running.
-
Documents/Files: Files that were created on disk.
-
Network Connections/IP addresses: IP addresses are shown as network connection icons.
Line Types
-
Invoked: A solid line indicates that one process invoked another process, file, or network connection.
-
Injected: A dashed line indicates that one process injected code into another process.
-
Read Memory: A dotted and dashed line indicates that one process attempted to read the virtual memory of another process (but did not inject into the process).
-
Accessed Target: A dotted line indicates that one process attempted to enter another process (but did not inject into the process).
Selected Node Details Panel
Click a node to view additional node information and take action in the Selected Node Details collapsible panel.
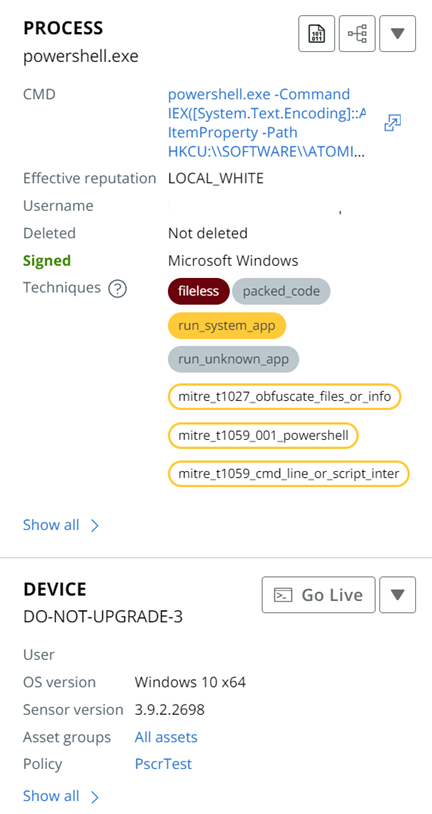
Each section of the panel offers actions that you can perform on the particular element. For example, the Device element allows you to:
- Start a Go live session to the device
- Enable bypass
- Quarantine the asset
Click Show all > to see more details within a section.
Scroll down the panel to see additional sections; for example:
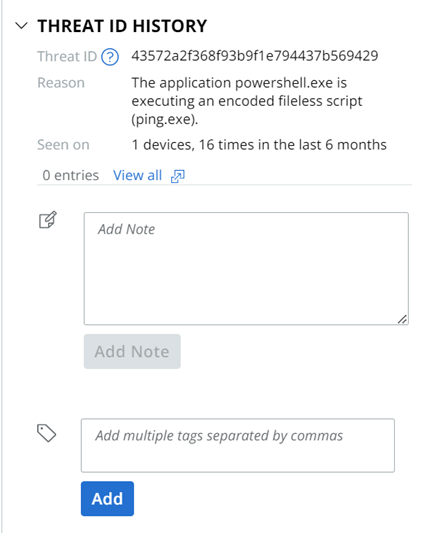
Observations Panel
The bottom section of the Alert Triage page displays Observation details, including:
- Time of the alert
- Reason for the alert
- Process username
- Asset
- Att&ck Tactic
