To view the status of a Kubernetes Sensor in a cluster, perform the following procedure.
Procedure
- On the left navigation pane of the console, do one of the following depending on your system configuration and role:
- If you have the Kubernetes Security DevOps or SecOps role and your system has the Containers Security feature only, click .
- If you have any other role and your system has Container security and other Carbon Black Cloud features, click .
- On the Kubernetes Clusters page, click the Clusters tab and then click the General tab.
- In the left pane, you can filter the list of displayed clusters by:
- Status
- Sensor Version
- Operator Version
- Cluster Label Key
- Cluster Label Value
- In the Clusters panel, you can search for a cluster, and you can select a displayed cluster name to view sensor health data.
- Select the cluster and view Status in the right panel.
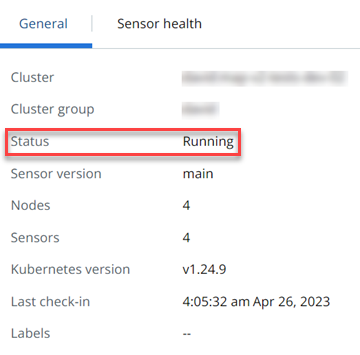
Table 1.
Kubernetes Sensor Status
| Status |
Description |
| Critical |
No activity has been detected from any cluster components for more than 24 hours |
| Error |
A critical component is down or the status cannot be detected |
| Pending install |
Cluster setup is in progress |
| Running |
All components are up and running without errors |
| Warning |
A non-critical component is down, or the status cannot be detected |
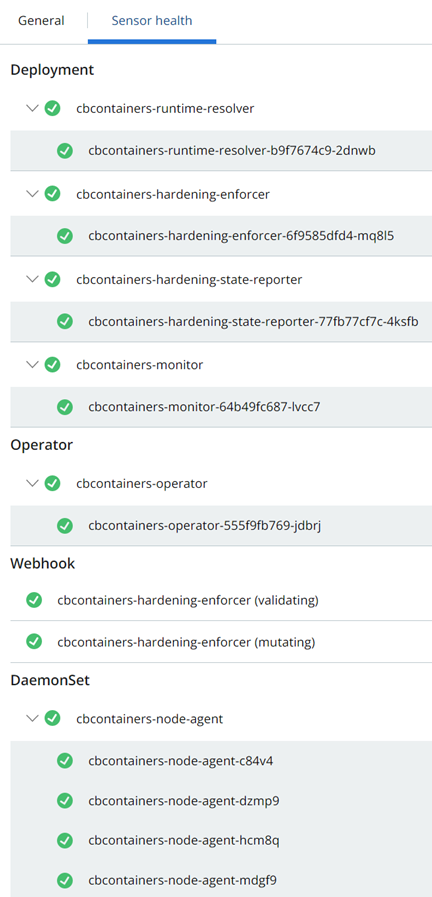
- Click the Sensor health tab.
To expand any entry, click the arrow  icon on the left. For example: