


This section contains troubleshooting information for problems associated with ServiceNow Apps.
Verify the Carbon Black Cloud URL
Solution:
The URL in the configuration must be the Carbon Black Cloud Hostname or the URL when you are logged into the Carbon Black Cloud console.
Example: https://dashboard.confer.net
Check Application Logs
Solution:
If you experience any errors, check the application logs to get information about the error and how to resolve it.
Access to the application logs requires the ServiceNow Administrator role. Go to System Logs > System Log > Application Logs or VMware Carbon Black Cloud > Application Logs.
Cannot Create a New User
Problem:
Cannot create a new user in the ServiceNow instance.
Solution:
Follow the steps in the ServiceNow User Administration Guide.
Cannot Install or Activate Plugin
Problem:
Cannot install or active a plugin in the ServiceNow instance.
Solution:
Follow the steps in the ServiceNow Plugin Administration Guide.
Empty Configuration Record in Fresh Instance
Problem:
When you install the application on a fresh instance and try to configure a new profile, sometimes it saves the configuration profile with empty values and does not allow you to enter values in Configuration.
Solution:
- Clear the Cache by going to: https://{{servicenow instance url}}/cache.do.
- Logout from the Instance and login again.
- Create a new configuration profile by providing empty values. It will submit field validations and will not save the configuration.
Not Getting Alerts in ServiceNow
Problem:
When you start data collection for the Configuration Profile, you do not get an alert in the Alerts table.
Solution:
- Open the Configuration Profile.
- Go to the Alert Filtering section.
- Check the Filter Condition in Custom Query.
For specific filters such as
Device OS=Other,Type=Device Control, and so on, there might be no alerts in a specific time range. - Change the time range for data collection or remove the filter and perform the data collection.
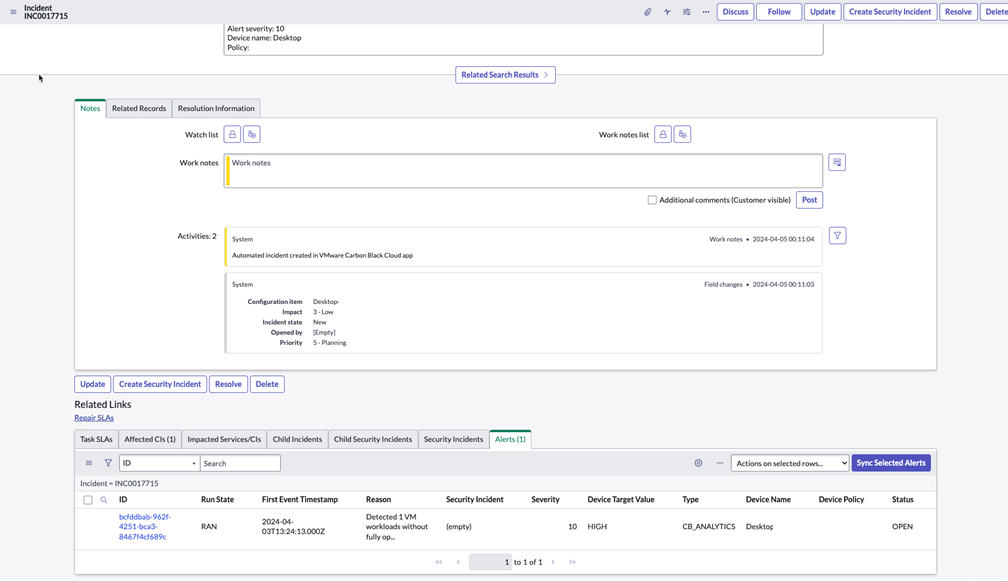
Cannot see Alerts Associated with an Incident
Solution:
To view the list of alerts that are associated with an incident:
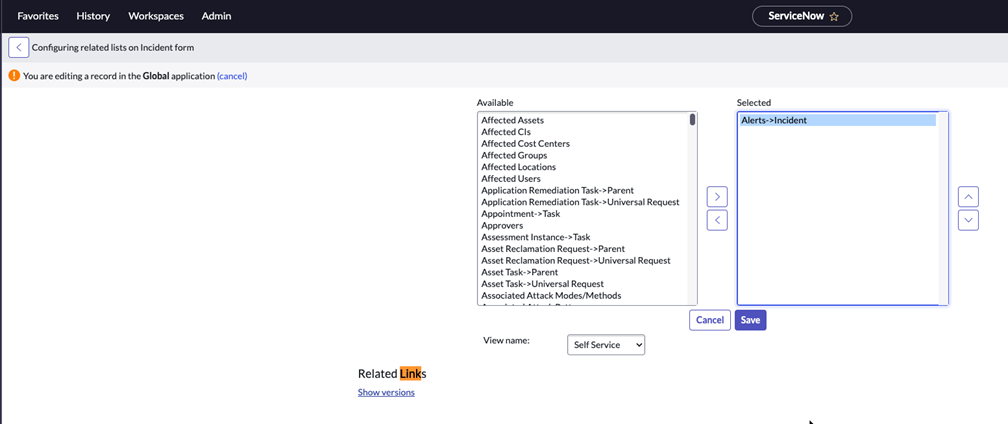
- On the Incident page, configure Related Lists from the Actions menu.
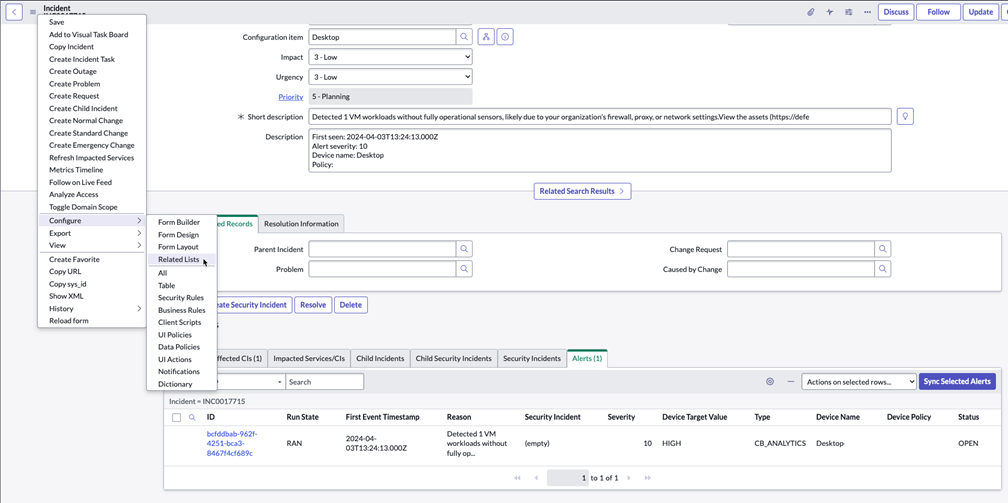
- Click Add Alerts > Incidents and click Save.
- Scroll down the Incident page.
- Click the Alerts tab to view the list of alerts that are associated with the Incident.
After you have configured Related Lists, the following table displays:
Queue Entry remains in New State or Exception Occurs when sending Decompressed Data
Problem:
While ingesting data from AWS S3 through an AWS SQS Queue, if the Carbon Black Cloud Data Source Import Queue Entry remains in the New state or an exception occurs.
Exception: Could not send the decompressed data to ServiceNow after 3 retries for the Queue with sys_id
Solutions:
- If the Carbon Black Cloud Data Source Import Queue entries remain in the
Newstate:- In the navigation pane on the left, type x_vmw_cb_connector_cbc_data_source_import_queue_entry.list to go to the Carbon Black Cloud Data Source Import Queue.
- Copy the
sys_idof the Queue entry that is in theNewstate. - In the navigation pane, type ecc_queue.list to go to the ECC Queue table.
- Apply the filter:
Agent is 'mid.server.' AND 'Payload' contains 'sys_id' AND 'state' is 'output'. - Open the ECC Queue entry.
- Change the state to
Ready.
- If the exception occurred in the MID Log file:
- Go to the MID Server log.
- From the exception message, copy the queue entry
sys_id. - In the navigation pane, type ecc_queue.list to go to the ECC Queue table.
- Apply the filter:
Agent is 'mid.server.' AND 'Payload' contains 'sys_id' AND 'state' is 'output'. - Open the ECC Queue entry.
- Change the state to
Ready.
Duplicate MID Server Logs
Problem:
When configuring a MID server, the following exception message displays:
Exception: WARNING *** WARNING *** An active MID Server with a duplicate name detected.java.lang. Exception: An active MID Server with a duplicate name detected.
Solution:
Change the name of your MID server or rename the existing MID server that has the same name.
If problems persist, see the ServiceNow Knowledge Base article.
When using the Data Forwarder, Alerts are not Ingested from the AWS S3 Bucket
Problem:
Alerts from the Data Forwarder are not ingested to ServiceNow from the AWS S3 bucket.
Solution:
The application scope must be VMware Carbon Black Cloud; otherwise, alerts will not be ingested from AWS S3 Bucket.
Dashboard does not Load
Problem:
Widgets or charts are not loaded in the dashboard and the message: Widget canceled - maximum execution time exceeded is displayed.
Solution:
- Go to System Definition > Transaction Quota Rules.
- In the list view of Transaction Quota Rules, search for Homepage Widgets in the Name column.
- Open Homepage Widgets and change the Maximum Duration (seconds) to 50 or more.
- Click Update.
- Reload the dashboard.
