


The Event Timeline is useful for investigating IOCs for events that occurred at a specific time.
A legend of color-coded event types appears at the top of the timeline. These colors are carried over to the bottom two timeline graphs to represent particular event types.
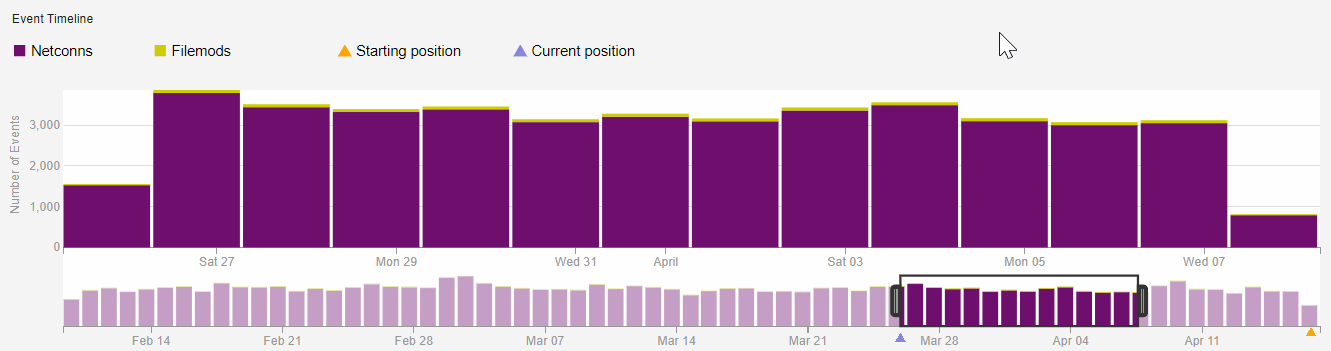
The top graph displays event counts, which are broken down into event segments. The top graph expands, collapses, and slides back and forth in conjunction with the time range window that you select in the bottom graph.
The bottom graph contains an interactive time range selector window that you can expand or collapse to zoom in, on, and out of the timeline. Place your cursor on the black handle in the graph and slide the range selector back and forth across the timeline to contract or expand it. Or, place your cursor inside the area that is defined by the handles and move the range selector window. As you move the range selector window, the process event list is updated (see Event List). The bottom graph includes two indicators:
-
An orange triangle, which represents the starting point of the segment selected from Process Search.
-
A purple triangle, which represents the current point of the segment that you are viewing in the events list.
