You can use the VM Monitor view in the vSphere Client to review and examine data related to a specific node VM that backs a database provisioned in the VMware Data Services Manager environment.

You can display the Monitor view for a database node VM by clicking the VM link in the Databases page as described in Step 4 of the Monitor Databases from the vSphere Client topic.

The following steps describe an alternative method to display this view by navigating to the VM in the vSphere Client inventory. After you display the Monitor view, you can review information, metrics, and operations related to the VM and its corresponding database. You can only review data presented in the Monitor view, but you cannot modify any parameters.

You can also generate VM logs and use them for troubleshooting.
Note: Information on the pages in the Monitor view for the database VM is available only to VMs that are managed by VMware Data Services Manager. The pages in the view display information specific to the VM you select. This information is VM and database node centric. However, additional data service information presented in this view is relevant to the entire database cluster.

For VMs that are not managed by VMware Data Services Manager, no information is displayed.

Procedure

  1. Select the VM in the vSphere Client inventory, and click the Monitor tab.
    The VM you select represents a particular database node.
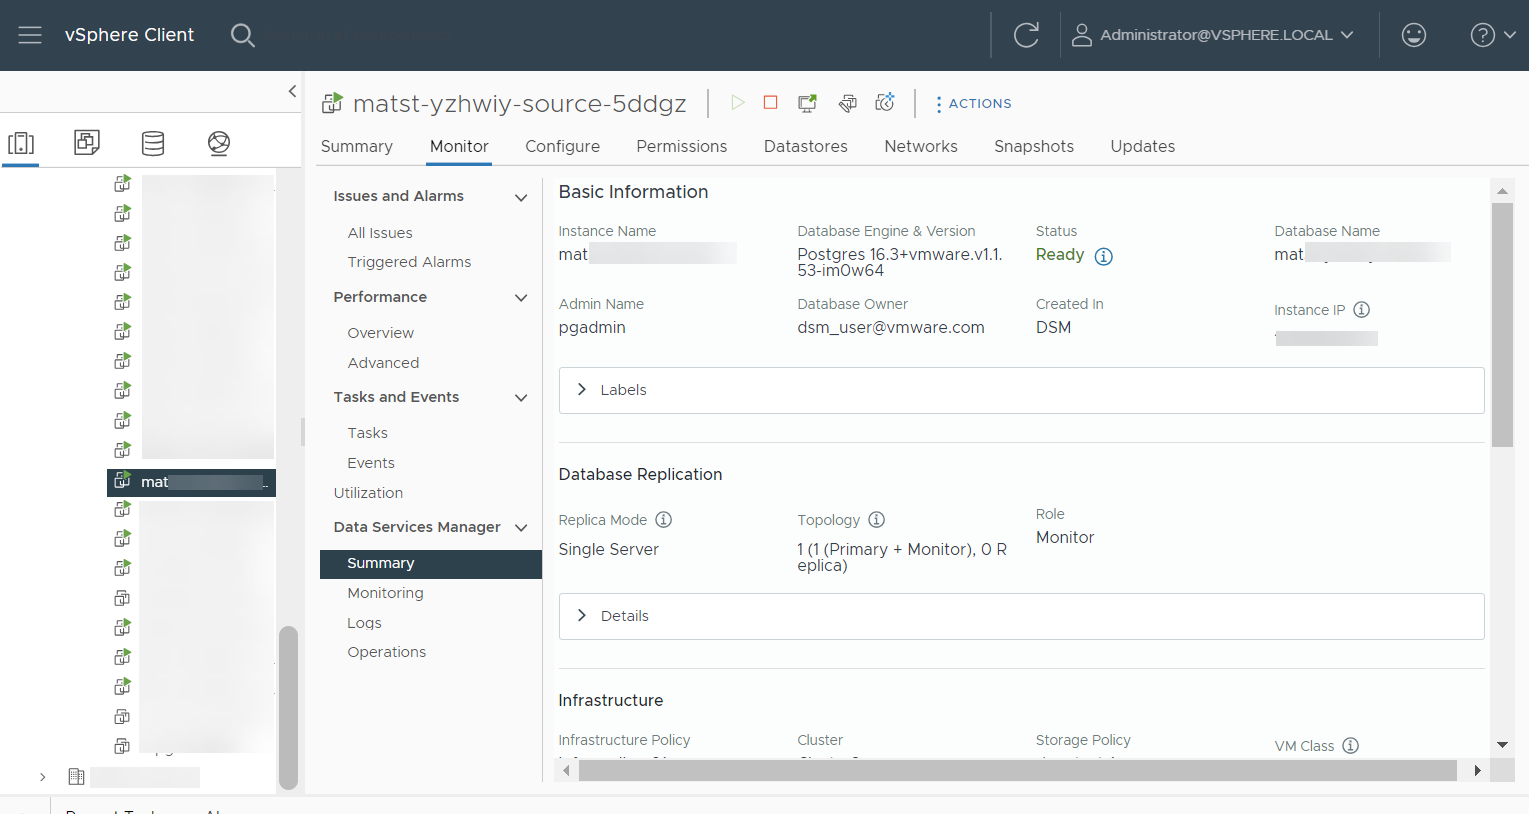
  2. Under Data Services Manager, click Summary.
    The Summary page displays information related to the database deployed on the VM, including database engine and version, owner, topology, infrastructure policies, and available upgrades. Information presented in this page is relevant to the entire database cluster.
    The page also shows the role of the VM node you selected, such as primary, monitor, or replica.

    Monitor DB VMs from the vSphere Client

  3. To review metric data for the database VM, click Monitoring under Data Services Manager.
    Use the Monitoring page to track the resource consumption, performance, and activity of the database VM.
    Available metrics depend on the type of database you are viewing and generally include, but are not limited to, the following parameters.
    Note: This page is not available for AlloyDB Omni.
    • Active Connections
    • Data Disk Usage
    • Write Throughput
    • Read Throughput
    • Thread Resource Utilization
    • Commits & Rollbacks
    • Deadlocks & Conflicts
    • Queries & Questions
    • Bytes Received & Sent
    • Slow Queries per Second
    • InnoDB Buffer Usage %
    • InnoDB Reads & Writes
    • Command Reads & Writes
    By default, the Monitoring page displays the last three hours of aggregated metric data. You can change this time period, calculated from current time, through the Time Range Last drop-down menu.
  4. Generate and download a log for the database VM.
    A log bundle that you generate aggregates relevant logs on the database VM, enabling faster diagnosis when the service faces an issue.
    1. Under Data Services Manager, click Logs > GENERATE LOG.
    2. After the system generates the log, click three dots next to the log name and select Download from the drop-down menu.
  5. To view and monitor operations that are targeted on the database VM, click Operations under Data Services Manager.

What to do next

For information about monitoring databases from the VMware Data Services Manager console, see Monitoring Databases from the VMware Data Services Manager Console.