To provide a test drive of the monitoring capabilities for the Edge Compute Stack solution, an all-in-one set of deployment manifests is available in the "metrics-in-a-box" folder of the ECS Sample Git Repository located here. These recipes allow the Edge Compute Stack host to stand up Prometheus and Grafana servers with a dashboard for a single site consumption already included.

Prerequisites

  • A deployed, registered and active Edge Compute Stack host which has been associated with a Git repository and is deploying workloads from this repository

Procedure

  1. Download or clone the Edge Compute Stack Sample Git Repository located here
  2. From within the Edge Compute Stack service go to the Monitor Section and select Hosts to display the deployed hosts
  3. Click the Serial number of the host which you would like to deploy the monitoring applications to
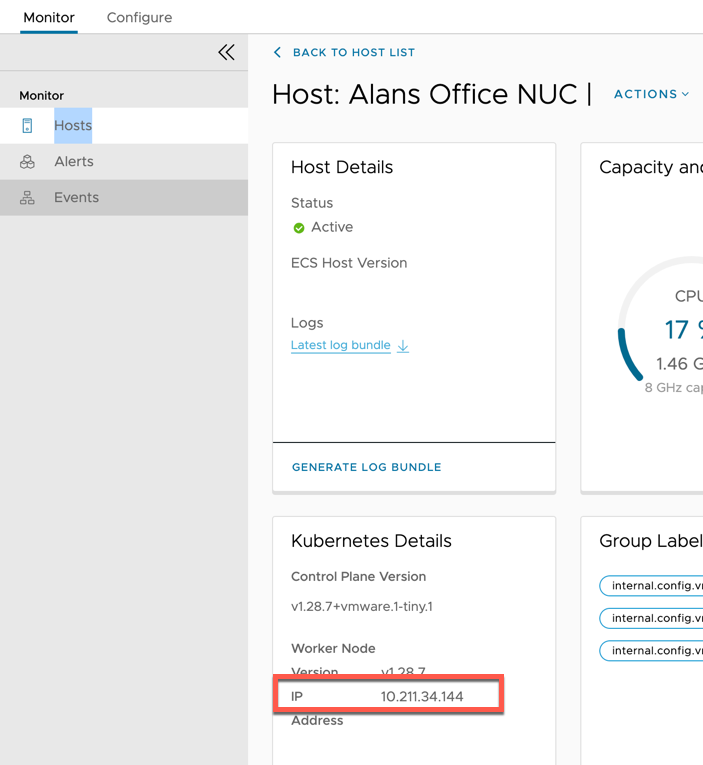
  4. On the Kubernetes Details tab you will find the worker node IP address


  5. Edit the 00-ecs-config.yaml file which was downloaded in step 1
  6. Un-comment the entries in this file
  7. Edit the host URL to include the worker node IP address previously captured
  8. Commit the folder or all files individually to your git repository which is currently associated to your Edge Compute Stack host
  9. On the next check-in the Edge Compute Stack host will deploy the monitoring solution and deploy a Prometheus and Grafana container
  10. The following sites should now be available (on your worker node IP and the same port)

    Grafana: http://192.168.6.234:30888/

    Prometheus: http://192.168.6.234:30777/

Results

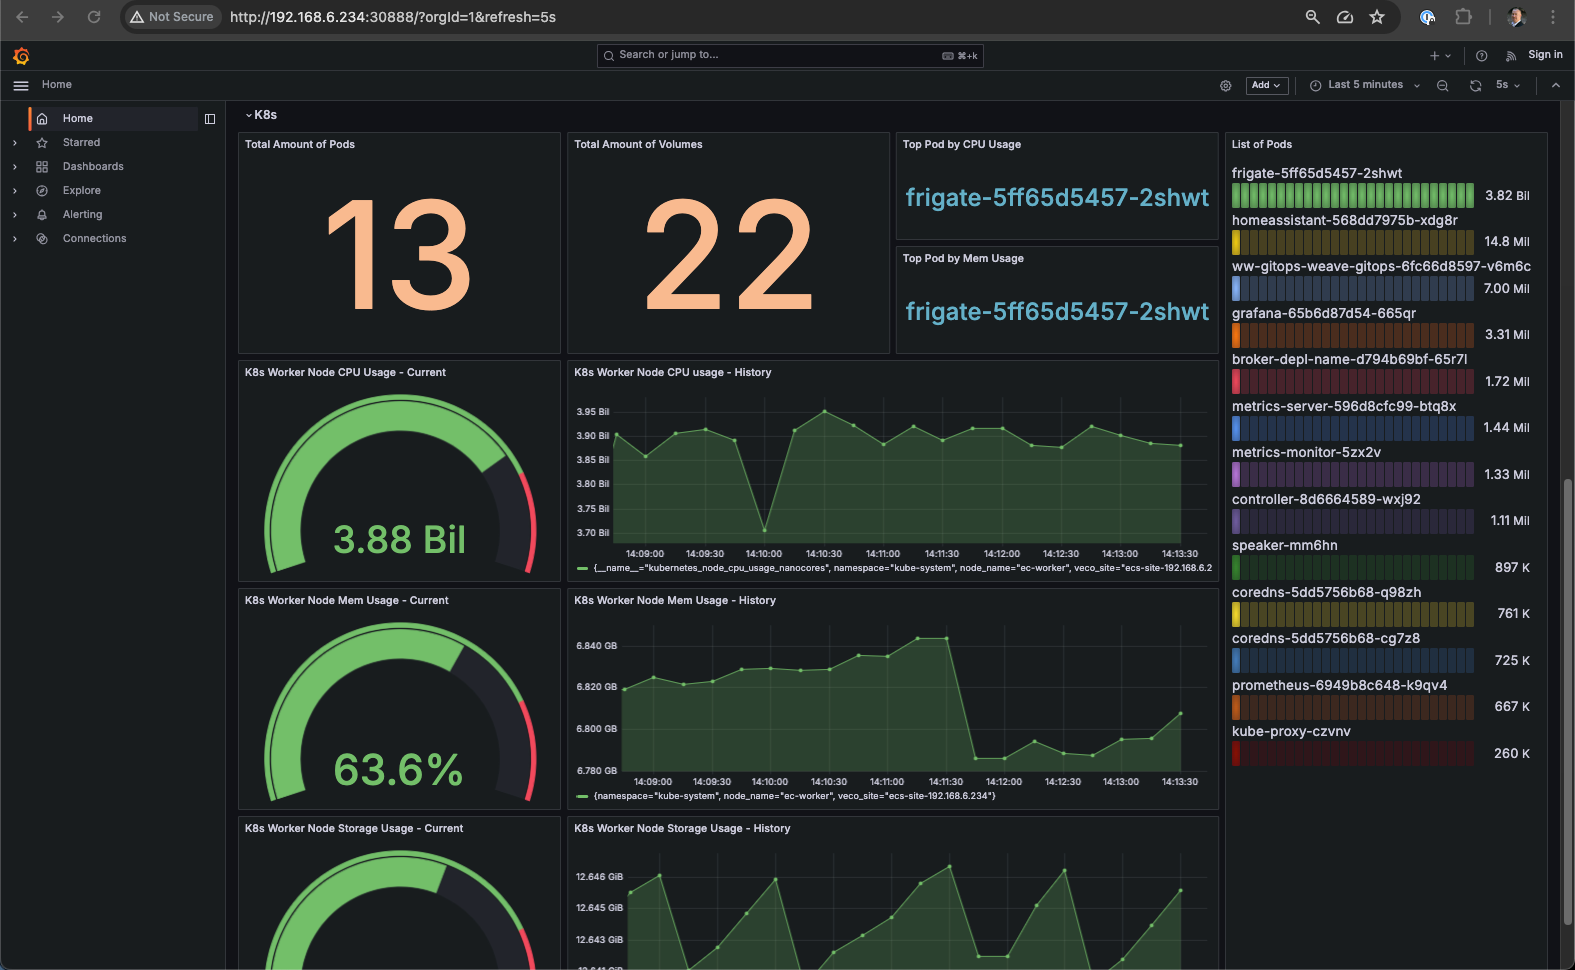
You should now be able to access the Grafana URL and a pre-populated dashboard will be available showing a monitoring example of both the Virtual Machine and Kubernetes workloads

Figure 1. Example Grafana Dashboard

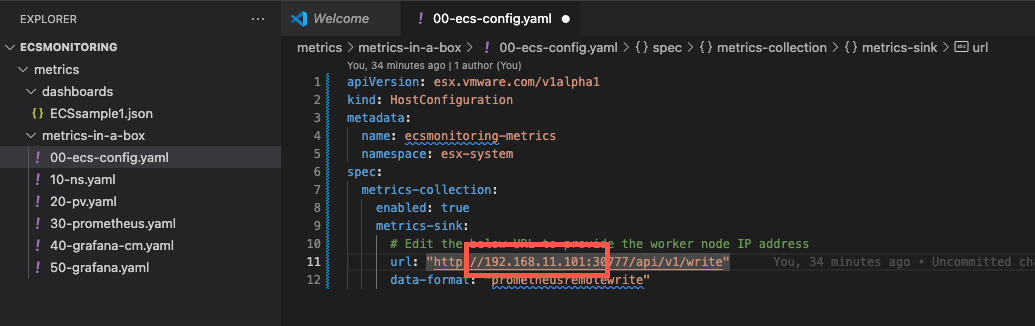
Example: Example completed 00-ecs-config.yaml file