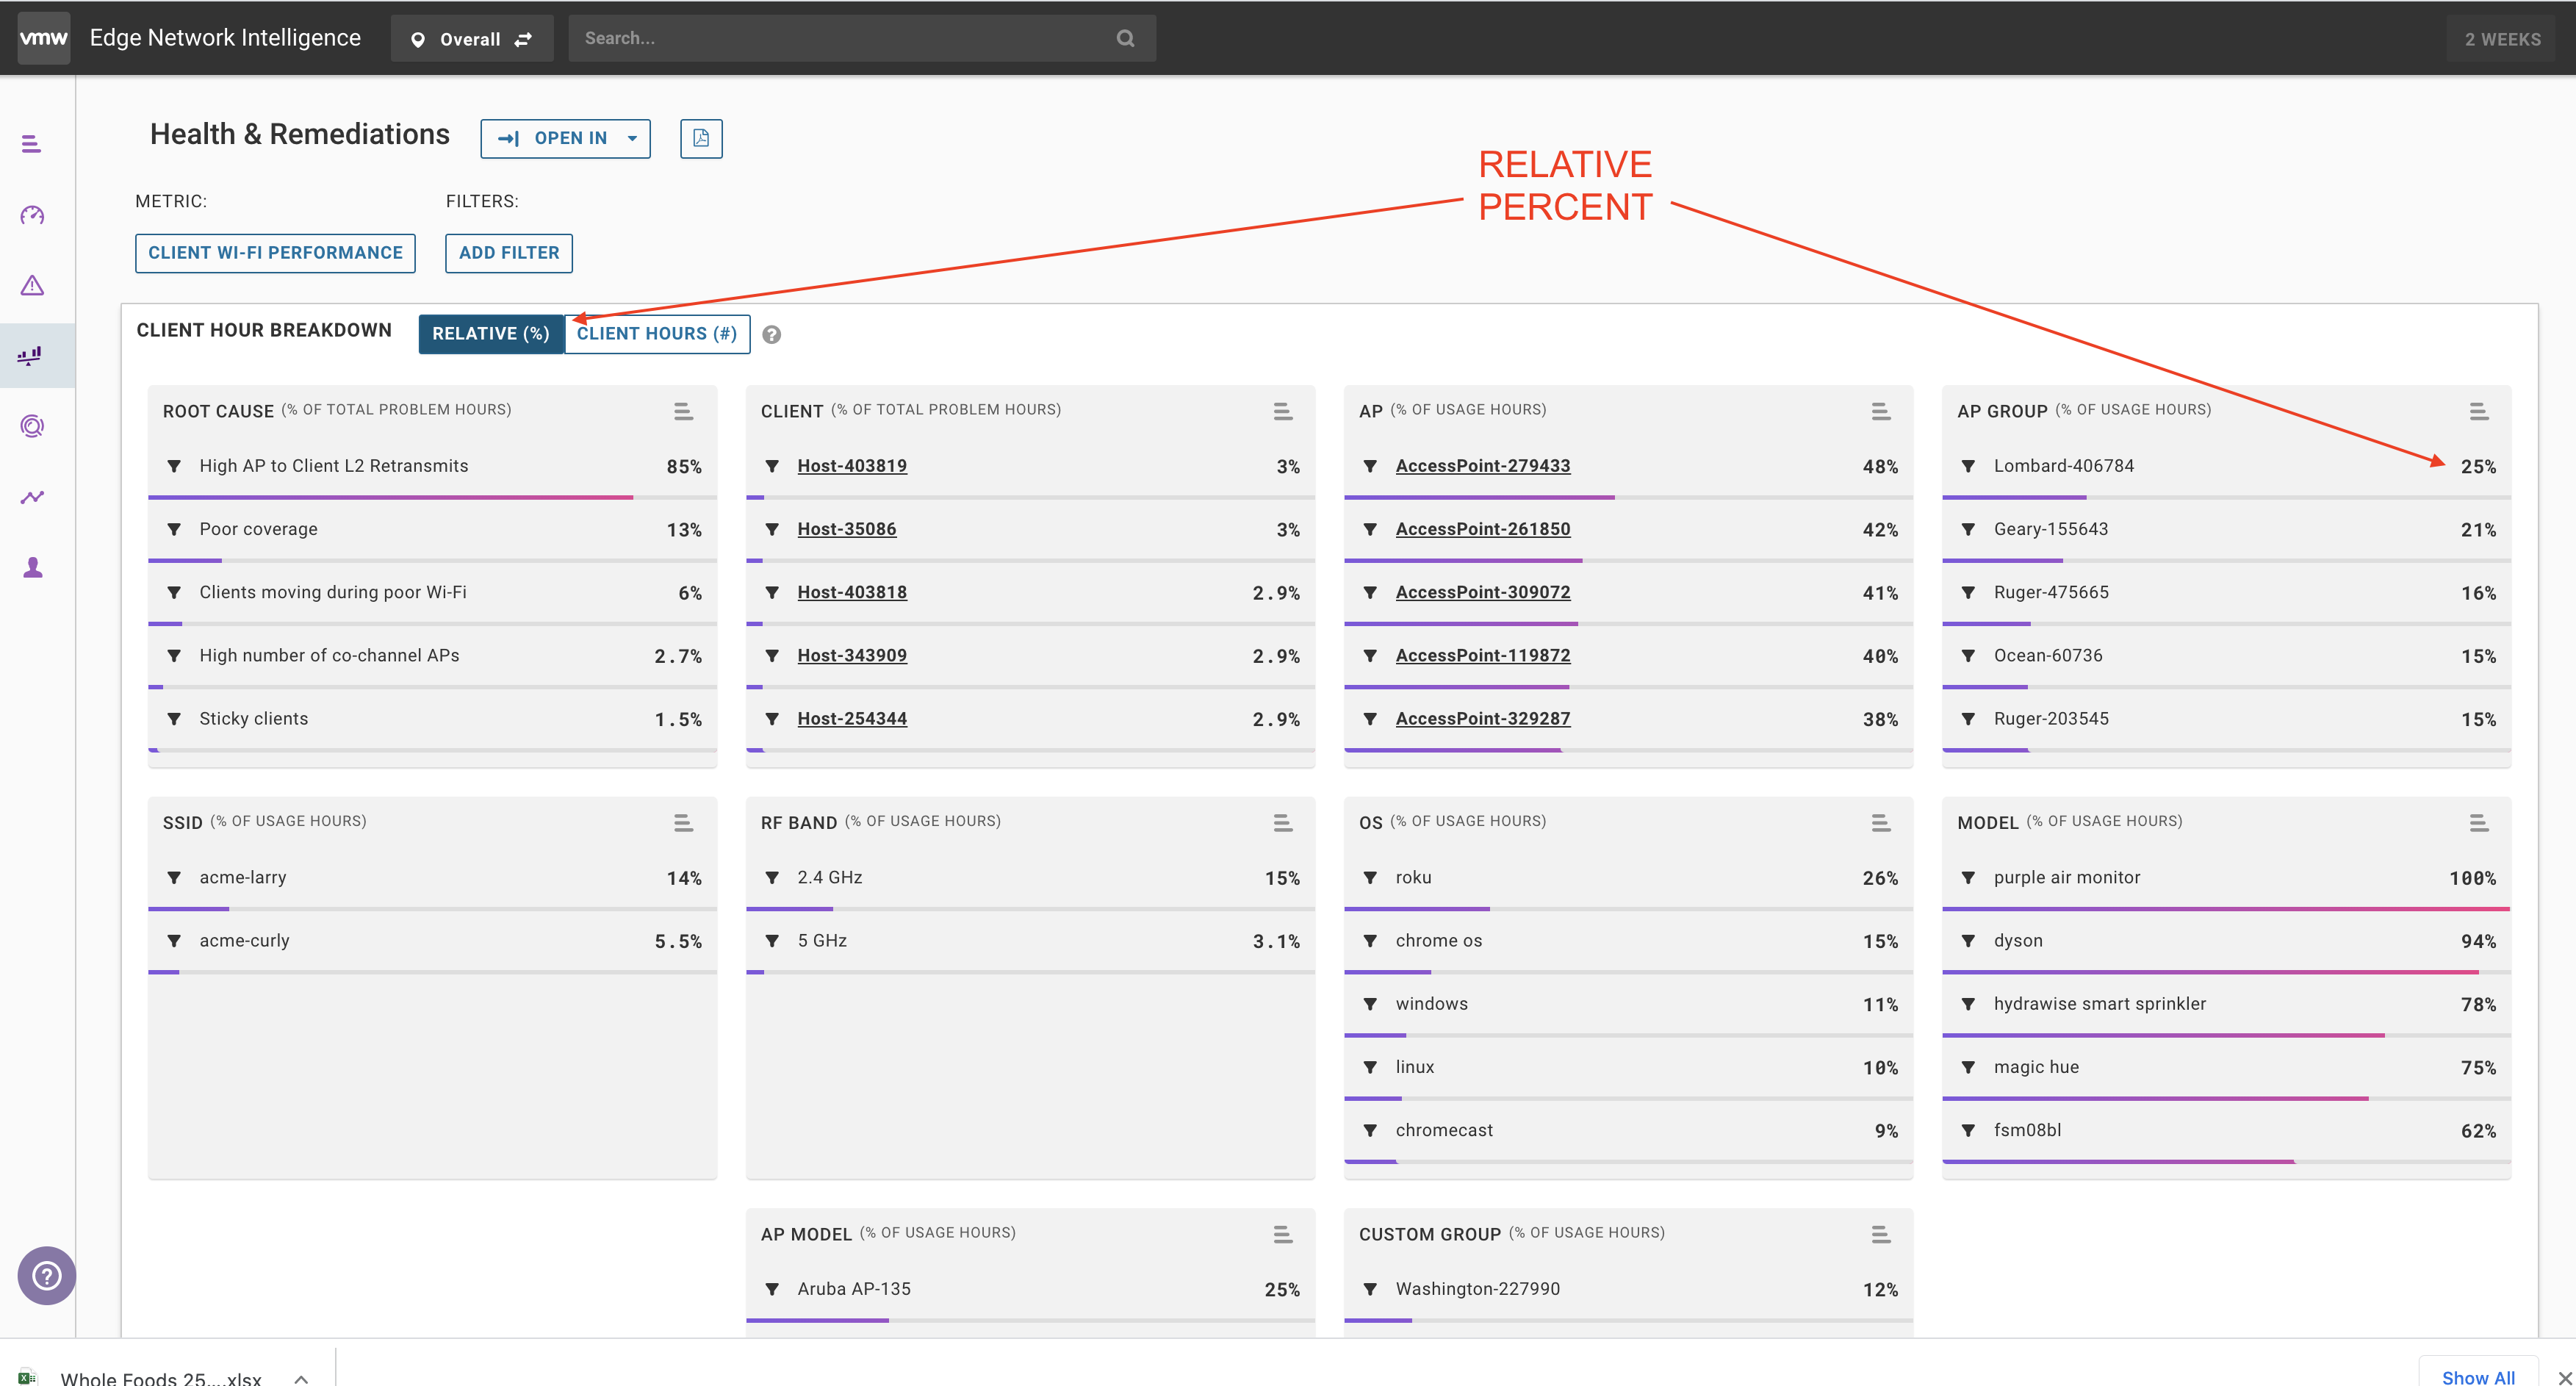
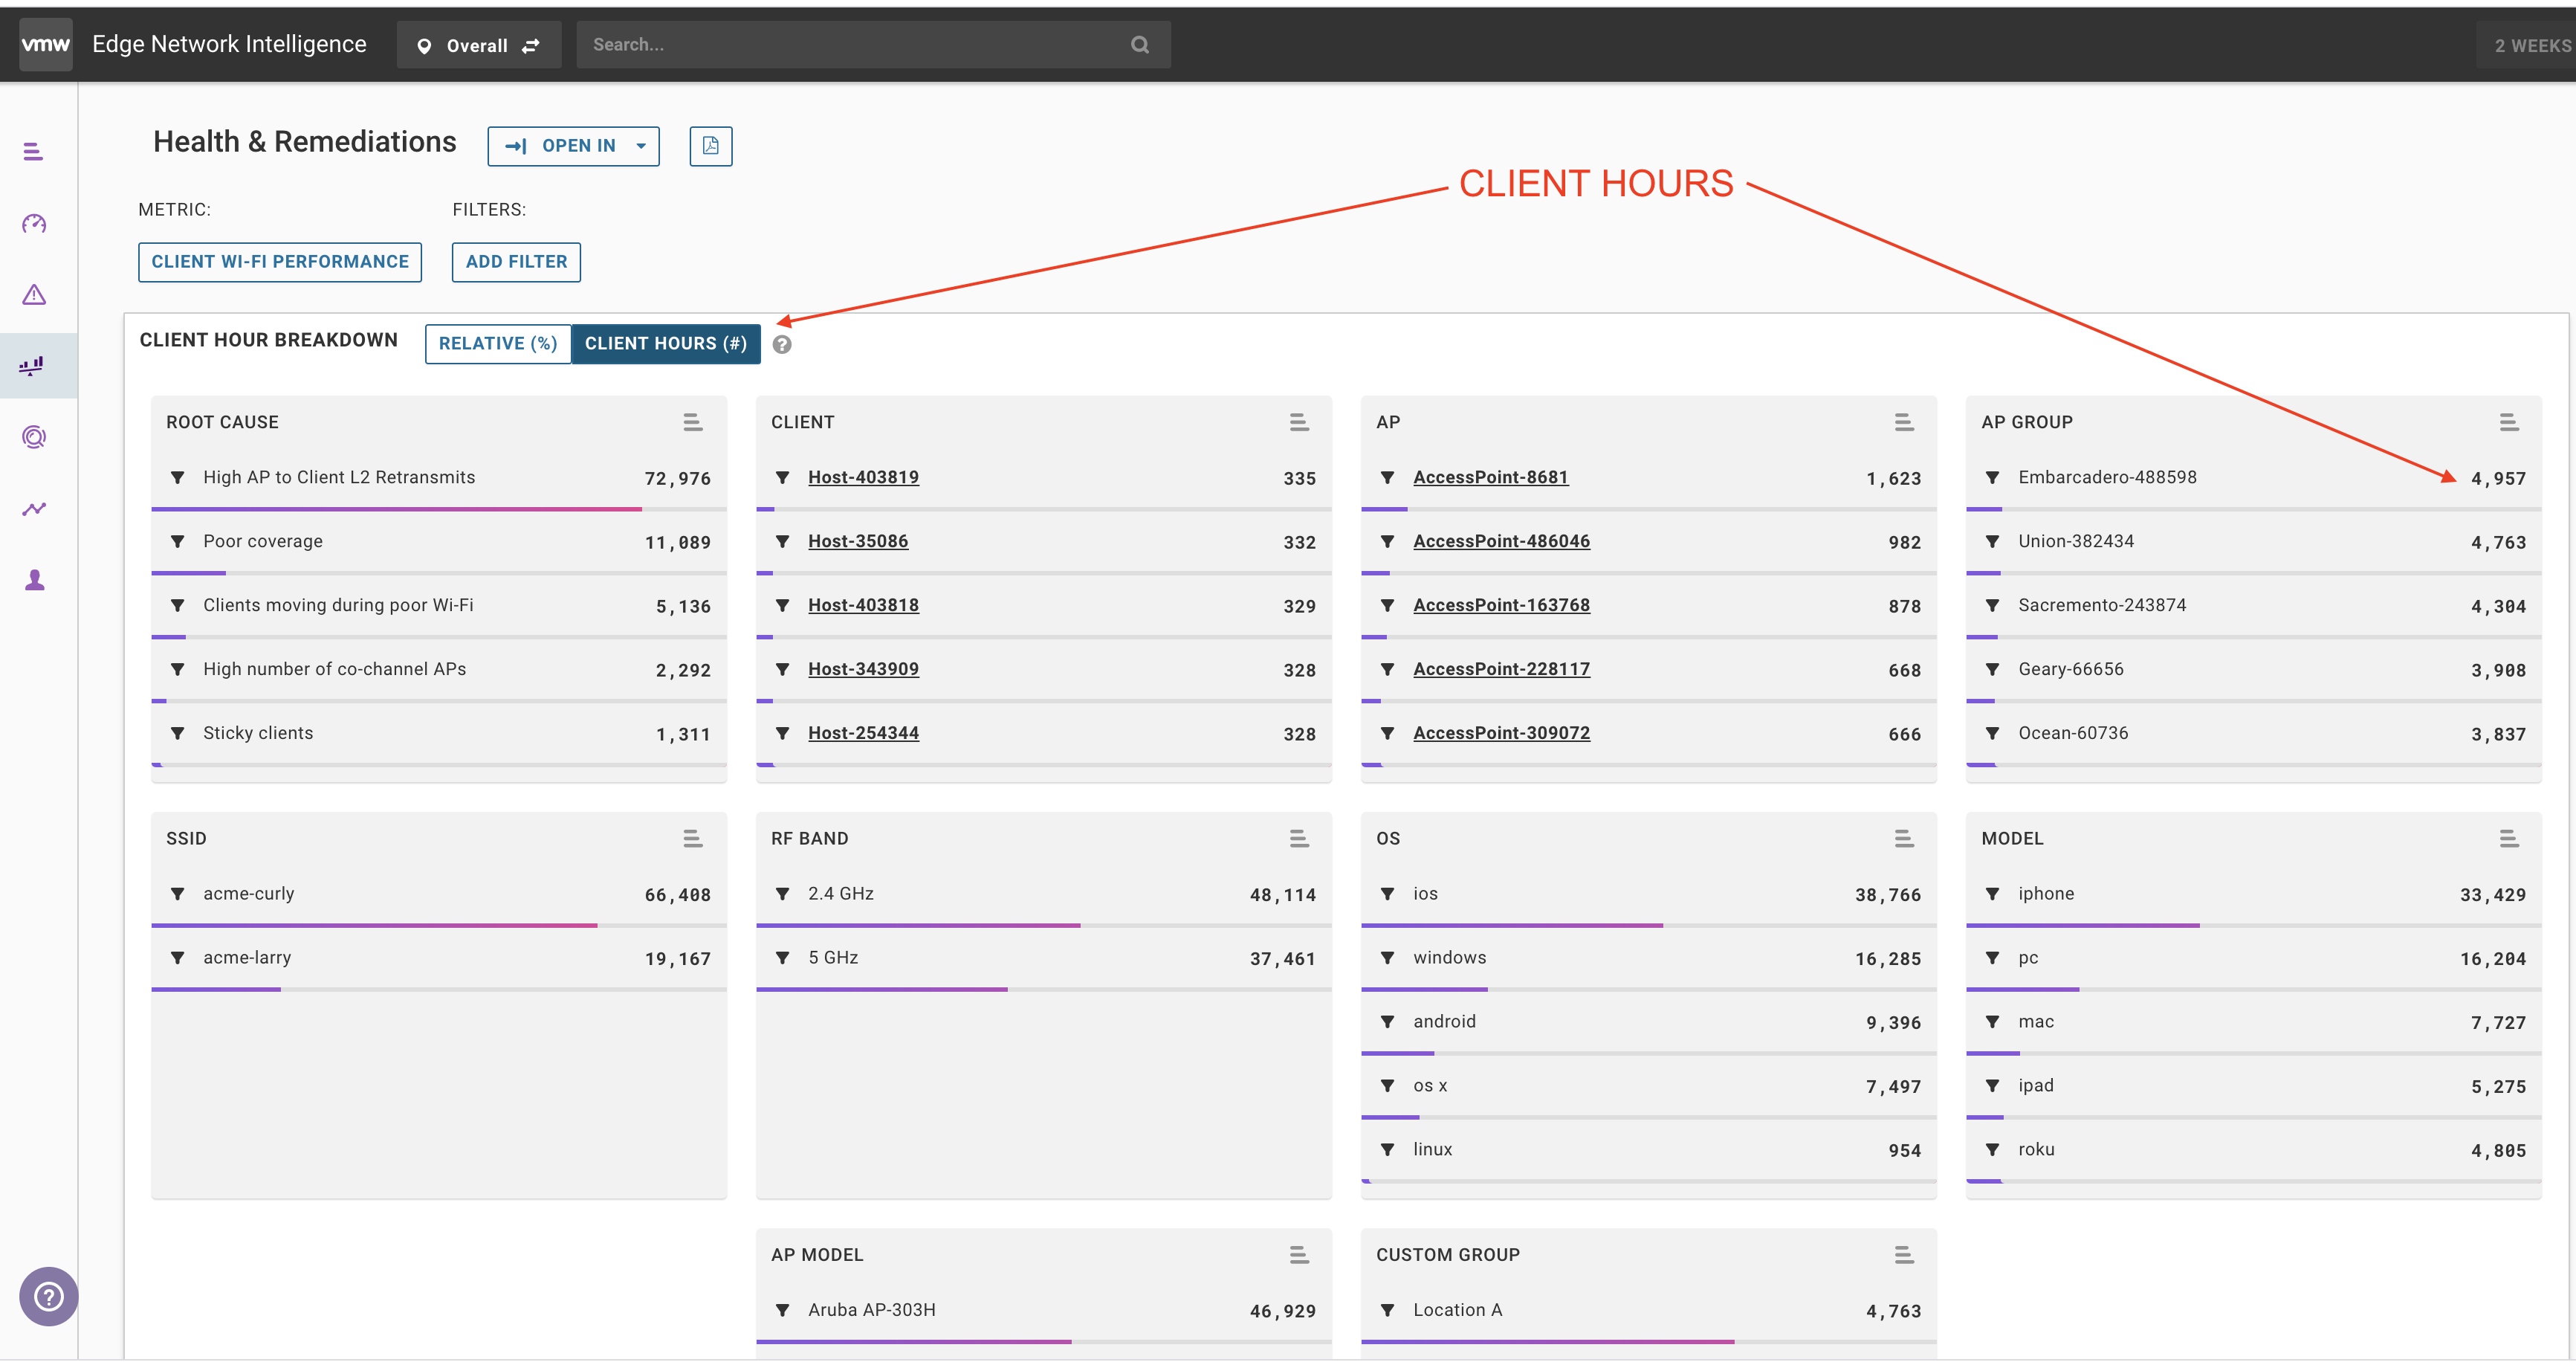
ENI uses two ways to sort performance issues - Relative % and Client Hours. Understanding these sorting terms is critical to be able to interpret the Health & Remediation page.
ENI uses Relative % and Client Hours to sort the information on the Health and Remediation page. You can switch between these sort options to better understand the impact a root cause has on a client or to understand the impact to a client. The following table describes the two options:
| Sort Option |
Description |
|---|---|
| Relative % |
The % of client devices using this metric that are affected by this metric. For example, if you are looking at Wi-Fi performance and you have 50% affected for a particular group that could mean that 2 devices are in the group and 1 had had problems, or there were 400 devices in the group and 200 had problems. |
| Client Hours |
The number of hours that the clients were affected by the selected metric over the last 2 weeks. For example, if a client device had O365 connectivity problems that affected them every day for an hour they would have 14 client hours for the selected metric. |
So, while Embarcadero has more problem hours, the user population in Lombard are consistently having more problems.

