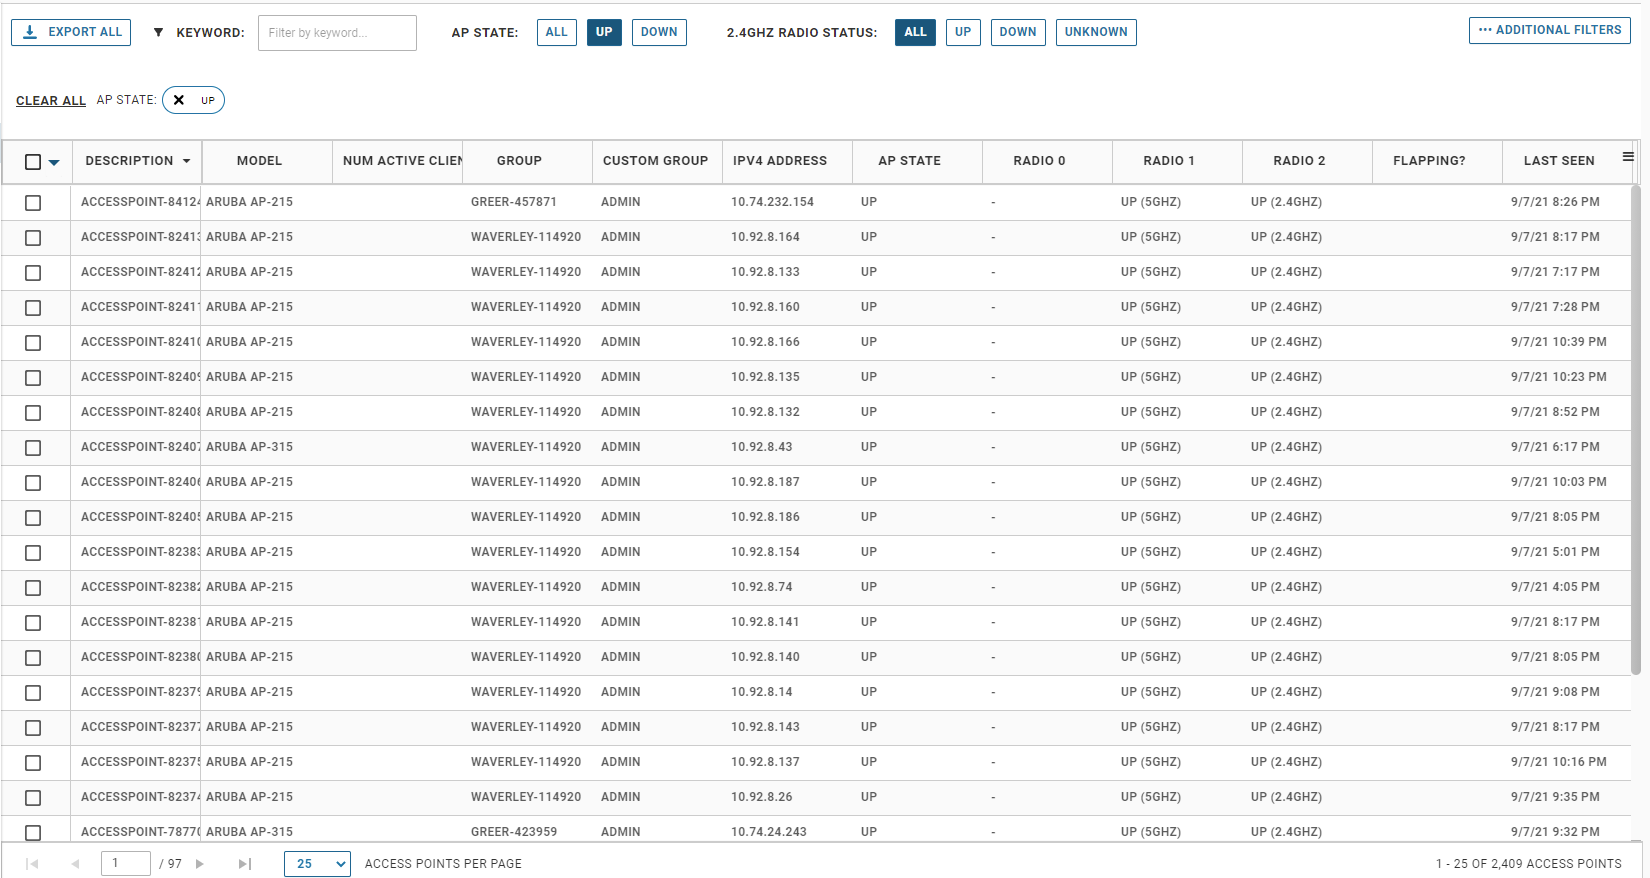
Go to Inventory > Access Points to view a list of Access Points that are dynamically identified if you have added controllers to VMware Edge Network Intelligence.
You can filter the Access Points based on the AP state, Radio status, and few other additional filters.
Click an Access Point to view its details. You can also get to the Access Points details page from any Access Point link in ENI or by searching for an Access Point in the search box. Access Points details are scoped by the time picker in the upper right corner and show details to the 1 min level for the last 2 weeks.

The top two cards show information about the AP including the switch port it is connected to, Radio details (channel, power, protocol etc.) and any historical items including HA controller.

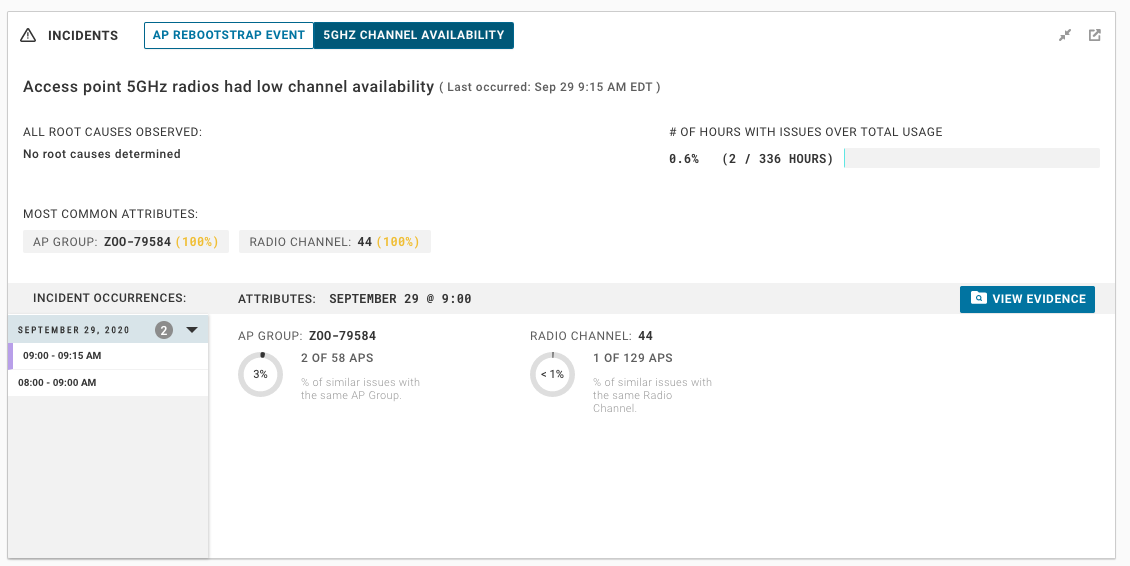
The AP incidents card shows any AP related incidents, including Radar events, Reboots, low channel availability etc. The details of the events include common attributes such as channel or AP groups. Clicking the View Evidence button takes you to the raw details ENI used to determine the issue.
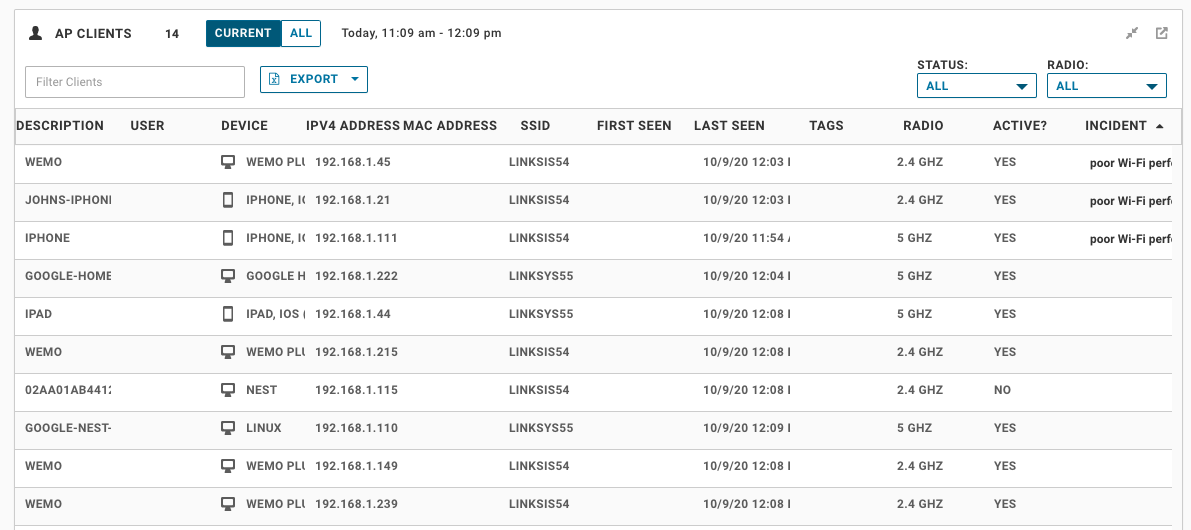
The AP clients detail card shows the list of clients that were connected to the AP in the time frame selected. NOTE: the details are the last seen values for the clients not the values scoped to the time picker.
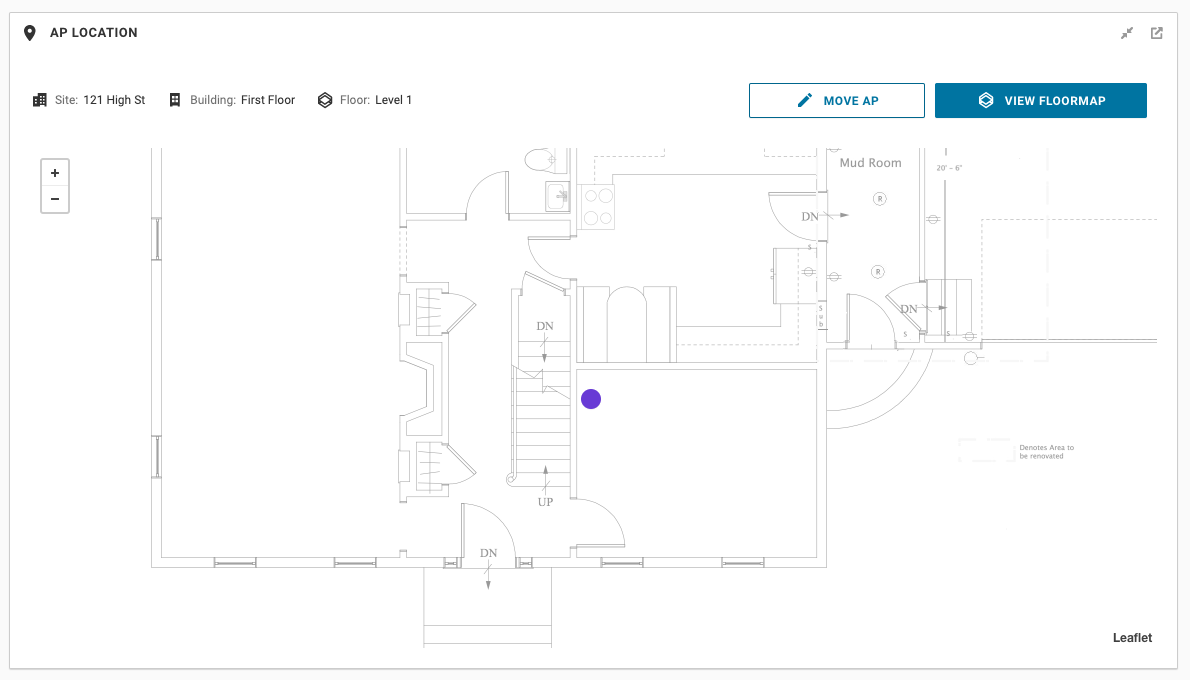
The AP location card shows the AP location on the floor map if the AP is associated with a floor plan and placed on the map
Access Point Neighbors card shows all of the neighbors to the selected AP. You can use this card to see what the density of the environment looks like and is a great way to understand how your radio power levels affect the number of neighbors seen and from a channel perspective where the overlap exists. You can adjust the SNR and RSSI thresholds to tune to your desired min levels. The Current, Max, and All buttons show you a snapshot of the history of the neighbors heard by this AP. The larger the ball the more clients, the darker the line the higher the RSSI, and if the ball is RED, it indicates the neighbor is on the same channel.

Rogue Access Points shows a similar graph with rogue AP's listed

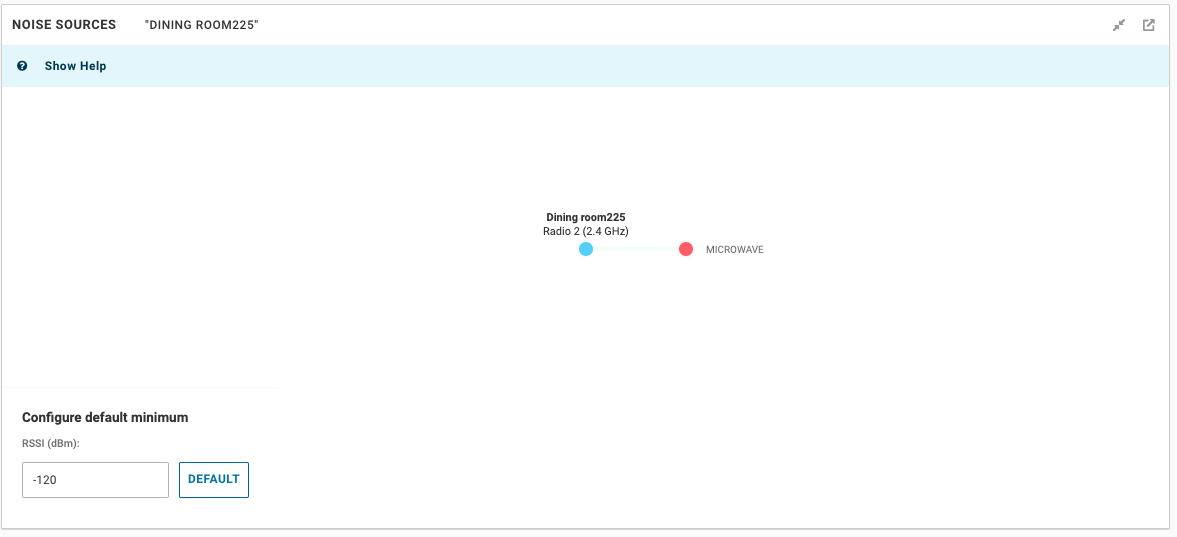
Noise sources is a similar graph showing AP noise sources. If you have spectral scanning turned on in your WLAN environment ENI will show you them on this graph.
The charts section shows you raw information about the AP and is very useful when debugging an issue. The RAW data for AP's is available for the past 2 weeks on a min by min basis.

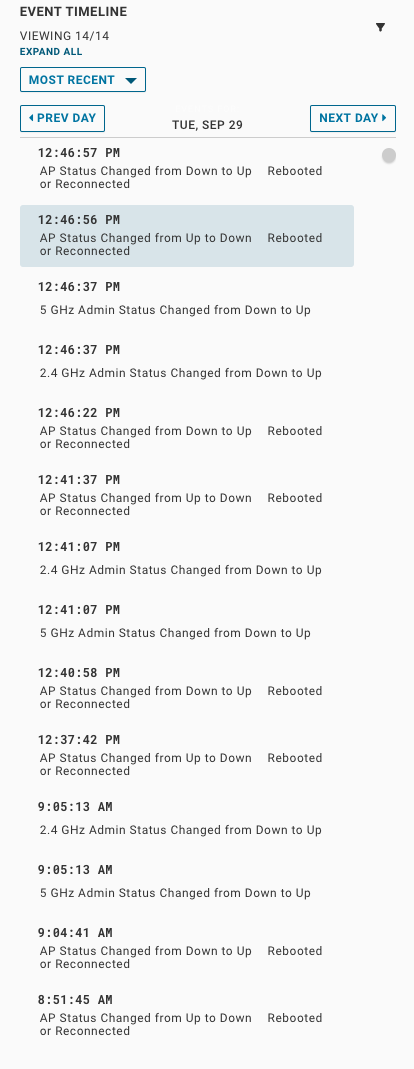
The AP event timeline shows information about channel and power changes, and reboots and rebootstrap events.
