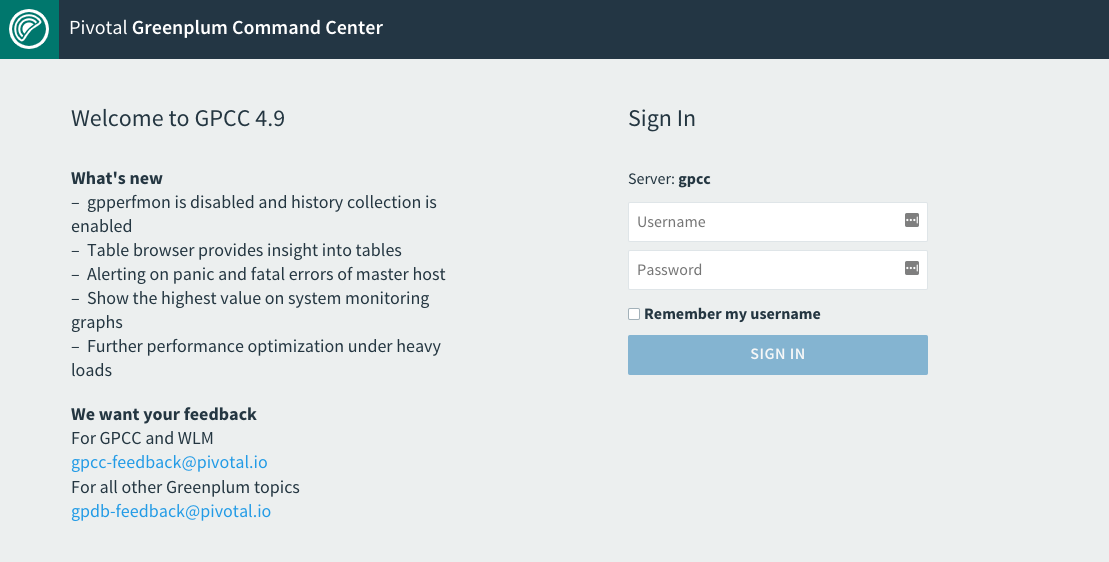
Sign in to the Command Center Console with a name and password. If the Guest Access to Query Monitor feature is enabled, you can sign in anonymously to see just the Query Monitor view.
Open the Command Center Console in a supported browser using the host name and port configured for the Command Center web server. For example, to open a secure Command Center connection on a host named smdw at port 28080, enter this URL into your browser:
https://smdw:28080

-
If the View Query Monitor link is present, you can click it to view the Query Monitor page without signing in. This takes you immediately to the Query Monitor view. To access additional Command Center features, click Sign In on the Query Monitor view and sign in with a valid Command Center user name and password. If the link is not present on the sign-in page, a Command Center administrator has disabled the anonymous query monitor feature.
-
To sign in as a Command Center user, enter the user name and password of a Greenplum role that has been configured to allow authentication to Greenplum Command Center, then click Sign In. This opens the Dashboard page of the Command Center Console, which provides a graphical system snapshot and a summary view of active queries. See the Dashboard for information about the Dashboard view.
If you install a new version of Greenplum Command Center using the same port number as the previous version, and you use the Chrome web browser, you may be unable to view real-time queries until after you clear the browser’s cache. Follow these steps.
- Choose Settings from the Chrome menu.
- Scroll to the bottom and click Advanced.
- Under Privacy and security, click Clear browsing data.
- Click the Basic tab and select Cached images and files. You do not have to clear Browsing history or Cookies and other site data.
- Click CLEAR DATA and then log in to Command Center.