


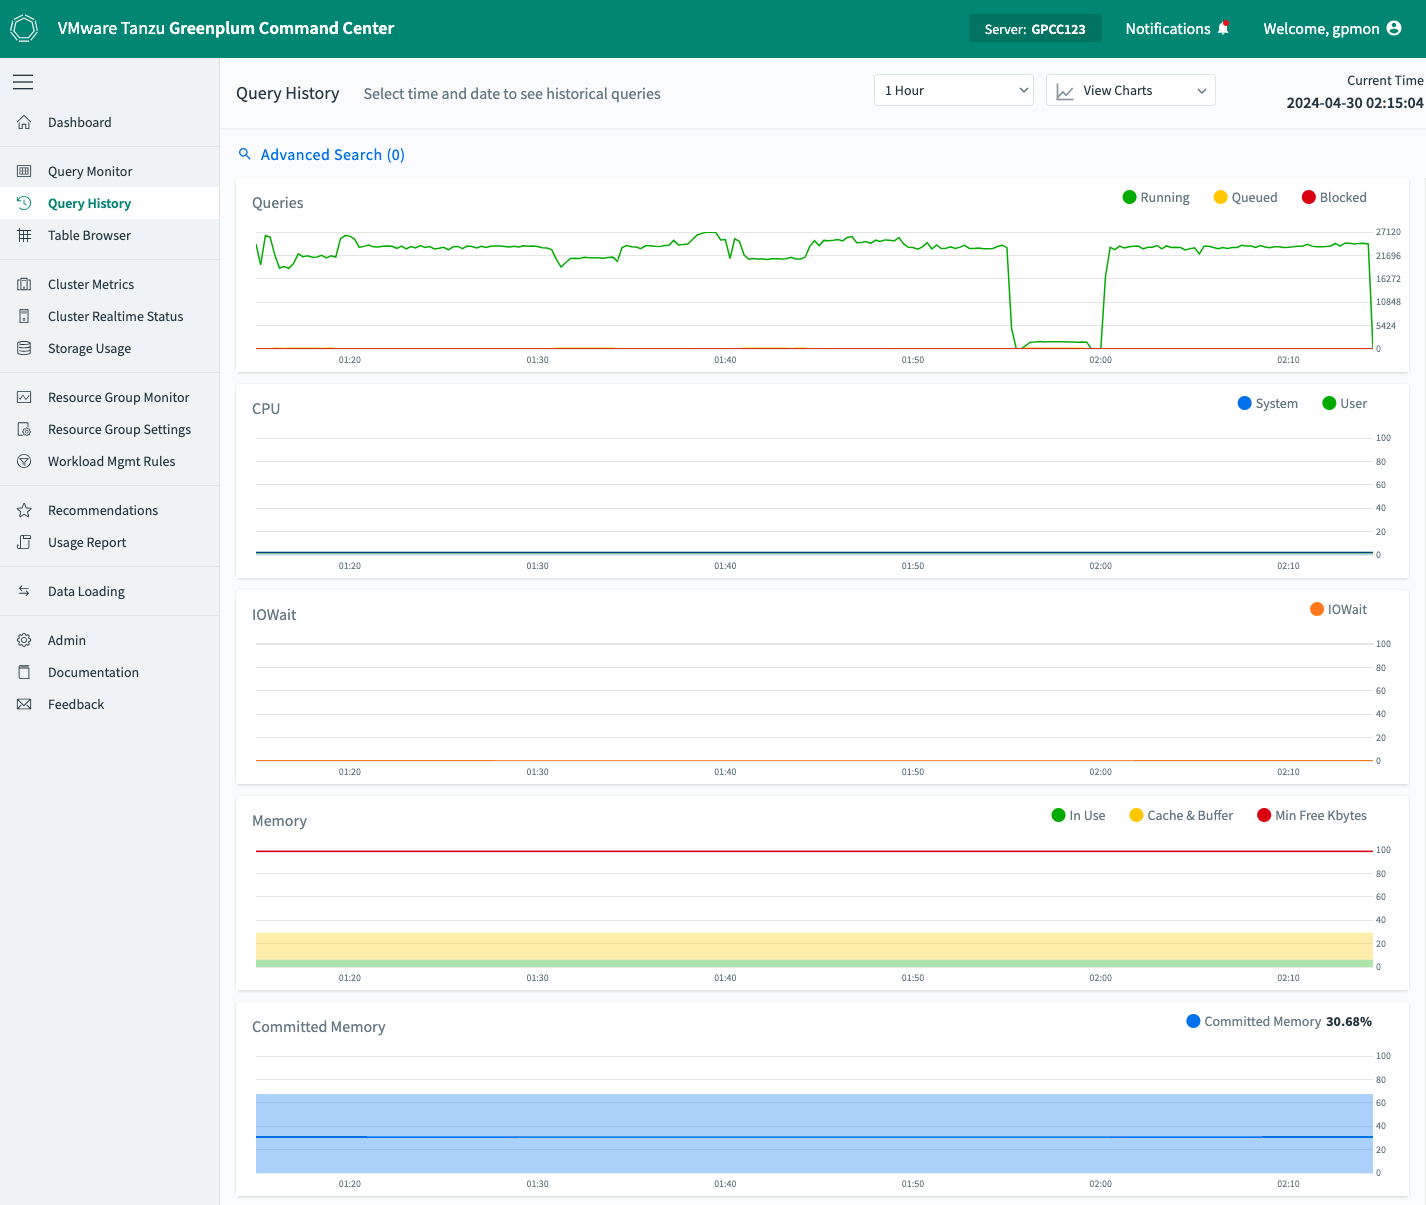
The Query History view allows you to display system metrics charts and and details about queries executed during a specified time period.
Use the Advanced Search tool to refine the query search results. The Queries Table shows the results and details of the search.
By default, the dashboard shows the last 1 hour of query history.
Note: On the Admin> Settings page, you can enable saving the real-time metrics collected by the VMware Greenplum metrics collector extension to history in the gpmetrics schema of the gpperfmon database. When you enable collecting this history, the Command Center History, Query Monitor, and Query Detail views all use data derived from the same data collection method.
If you disable GPCC query history collection on the Admin> Settings page, the history view displays data collected and saved in the gpperfmon database by the gpmmon and gpsmon agents. That data is not derived from the real-time metrics displayed in the Query Monitor and Query Detail view. Variations should be expected due to the different data collection methods.
To select a different time period (1 hour, 4 hours, 1 day, 3 days, and custom), use the time range dropdown:
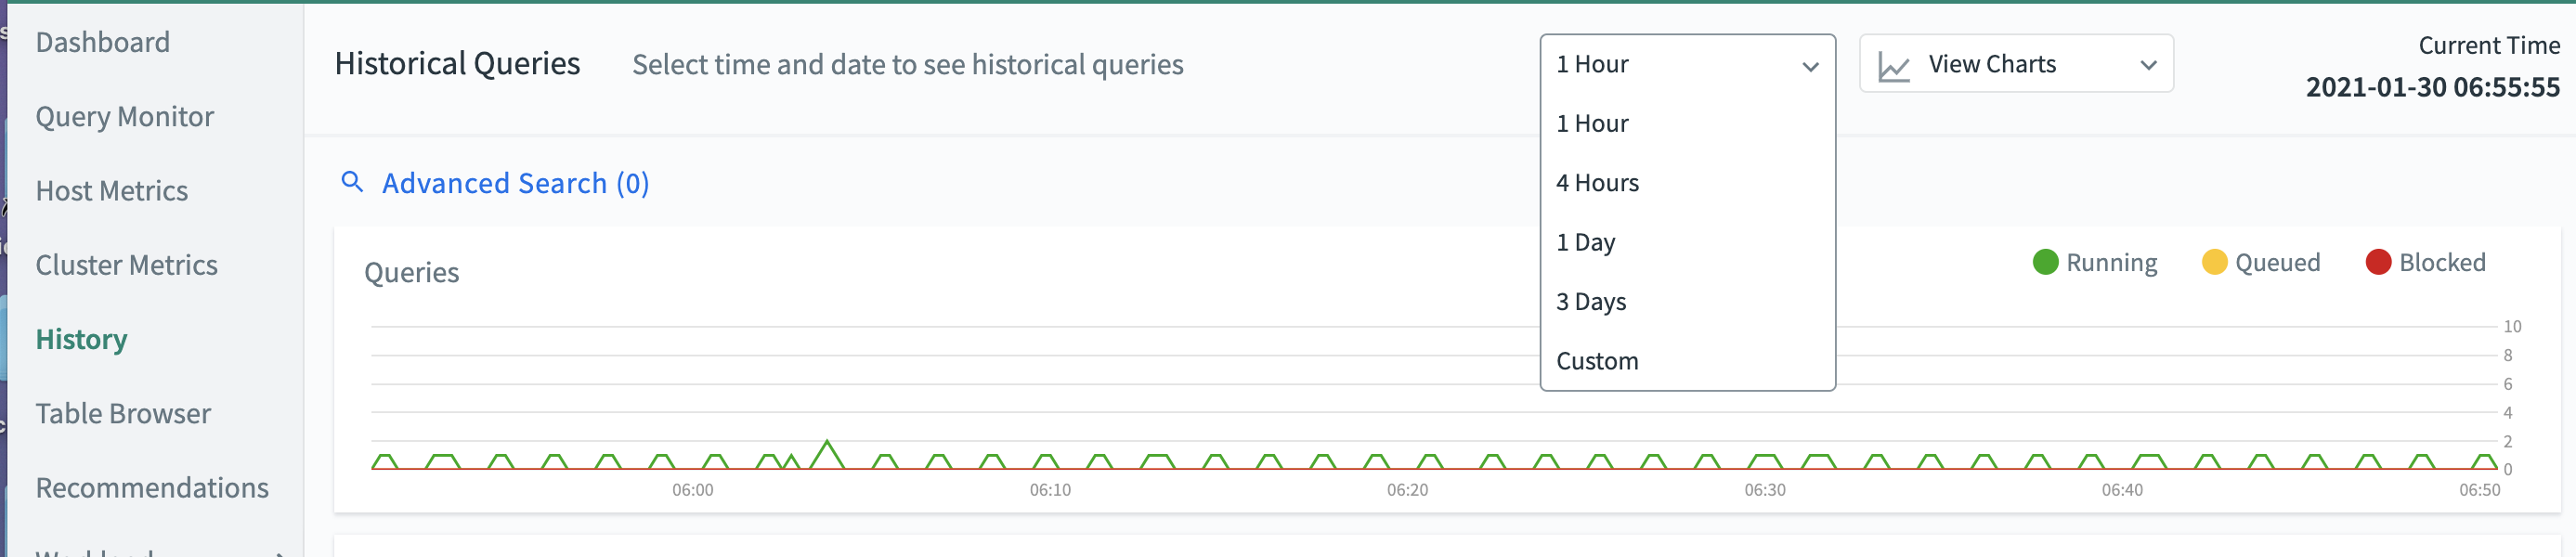
Selecting “custom” from the time period dropdown leads you to the Advanced Search popup window. See Advanced Search for more details.
To select which charts to view for the latest queries, use the View Charts dropdown. By default, the following charts are selected:
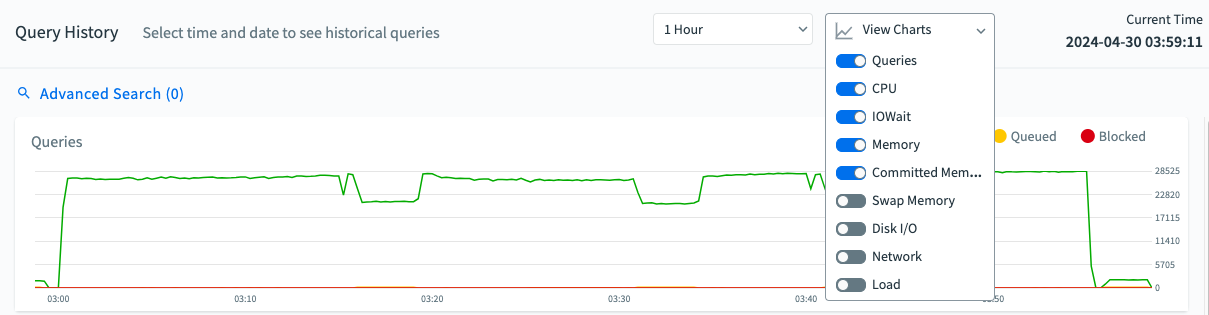
The following metrics charts are available:
-
Queries
The number of queries running and the number of queries queued to run.
-
CPU
The percentage of CPU used by system processes and user processes.
-
IOWait
The time waiting for disk I/O.
-
Memory
The percentage of memory in use.
-
Committed Memory
The percentage of Committed_AS memory in use. Committed_AS represents the current amount of memory allocated on the system. It encompasses all memory allocated by processes, regardless of whether it has been utilized by them yet or not.
-
Swap Memory
The percentage of swap space used.
-
Disk I/O
Disk read and write rates in megabytes per second.
-
Network
Network I/O read and write rates in megabytes per second. Network metrics include traffic over all NICs (network interface cards), including internal interconnect and administrative traffic.
-
Load
System load average for 1-minute, 5-minute, and 15-minute periods.
Advanced Search
Use the Advanced Search tool to restrict the query results displayed at the bottom of the history dashboard.
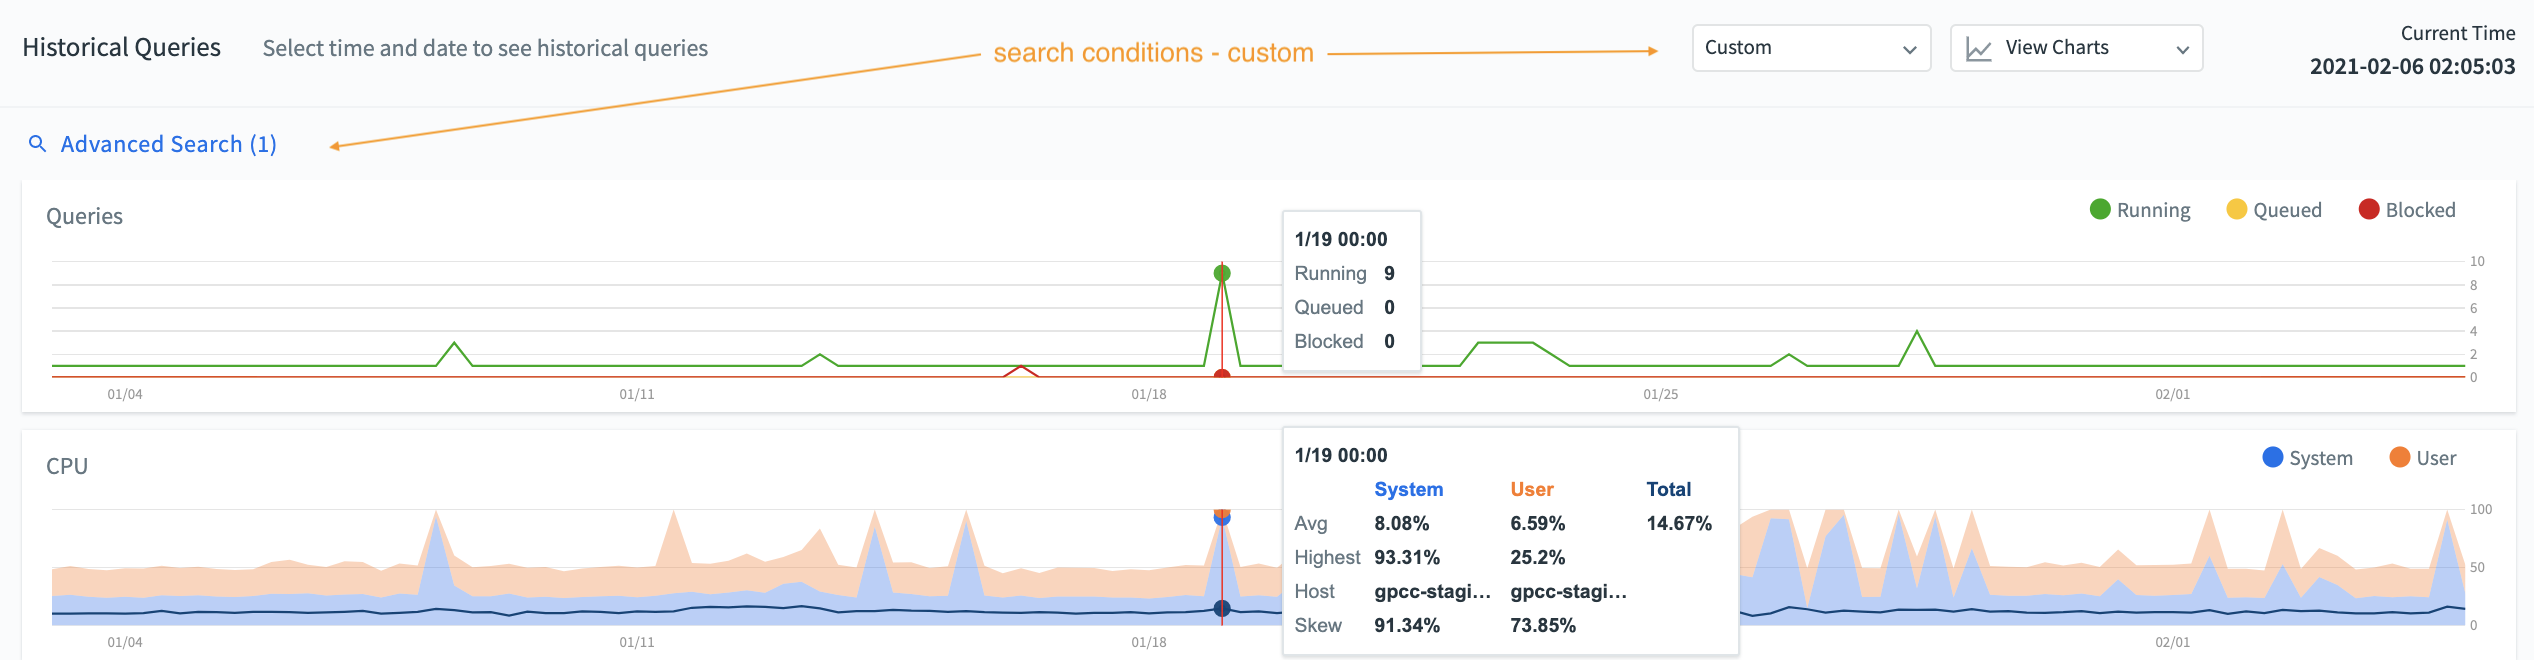
The number of search conditions is displayed beside the Advanced Search link. If the search conditions are greater than (0), the Time Range dropdown defaults to Custom. The search conditions number is retained between different Command Center dashboards. To reset it, select an option from the Time Range dropdown, or click the RESET button in the Advanced Search popup window. The search conditions go back to (0) if the user logs out.
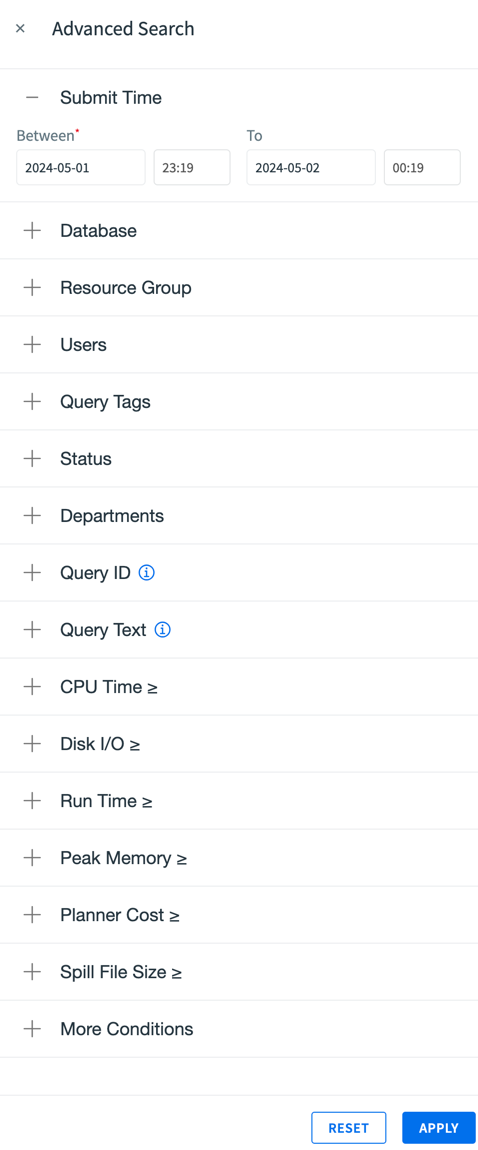
- Submit Time
- (Required) Select a valid time range in the YYYY-MM-DD, HH:MM format.
- Database
- Select one or more databases from the dropdown. Filtering by database(s) affects only the queries displayed in query results. The metrics displayed in charts include all activity during the selected time period.
- Resource Group
- Display queries executed or not executed by a specified resource queue or resource group.
- Users
- Enter a user, or a list of users, from the dropdown. Filtering by users shows the queries owned or not owned by those users. The metrics displayed in charts include all activity during the selected time period.
- Query Tags
- Enter the query tags for your query search, separated by semicolons.
- Status
-
Display queries that completed with the specified status:
Done,Cancelled,Error, orUnknown. - Departments
- Enter a department, or list of departments, from the dropdown. Filtering by department shows the queries owned or not owned by users from the specified department(s).
- Query ID
- Enter the query IDs for your query search, separated by commas.
- Query Text
-
Enter the keywords for your query search, separated by spaces, and within a limit of 256 characters. You may enter a
%wildcard to match any characters, for exampleSELECT%ABC%.
NoteNormal text input triggers “ILIKE” style matching; input enclosed in slashes “/” activates regular expression matching.
- CPU Time >=
- Select an integer for the seconds, minutes, or hours of CPU time the queries consume.
- Disk I/O >=
- Select queries with disk I/O above the specified Megabytes (MB), Gigabytes (GB), or Terabytes (TB).
- Run Time >=
- Select queries that consumed a specific CPU time in seconds, minutes, or hours.
- Peak Memory >=
- Select queries that consume the specified maximum memory usage number, in MB, GB, or TB.
- Planner Cost >=
- Select a planner, and a cost.
- Spill File Size >=
- Display queries that generated spill files of a certain size.
- More Conditions
-
Find queries that have CPU Skew
Display queries that had CPU skew greater than zero.
-
Exclude all canary queries
Returns queries without canary queries.
Click APPLY to display results that match your criteria. The number of conditions will be retained until your click RESET or select a time period in the History dashboard.
Queries Table
The Queries results table displays queries that were active during the specified Time Range or the Advanced Search conditions. The results can include queries that started before or finished after the specified time. However, queries that are still active are not included in the table; these queries can be viewed on the Query Monitor page.
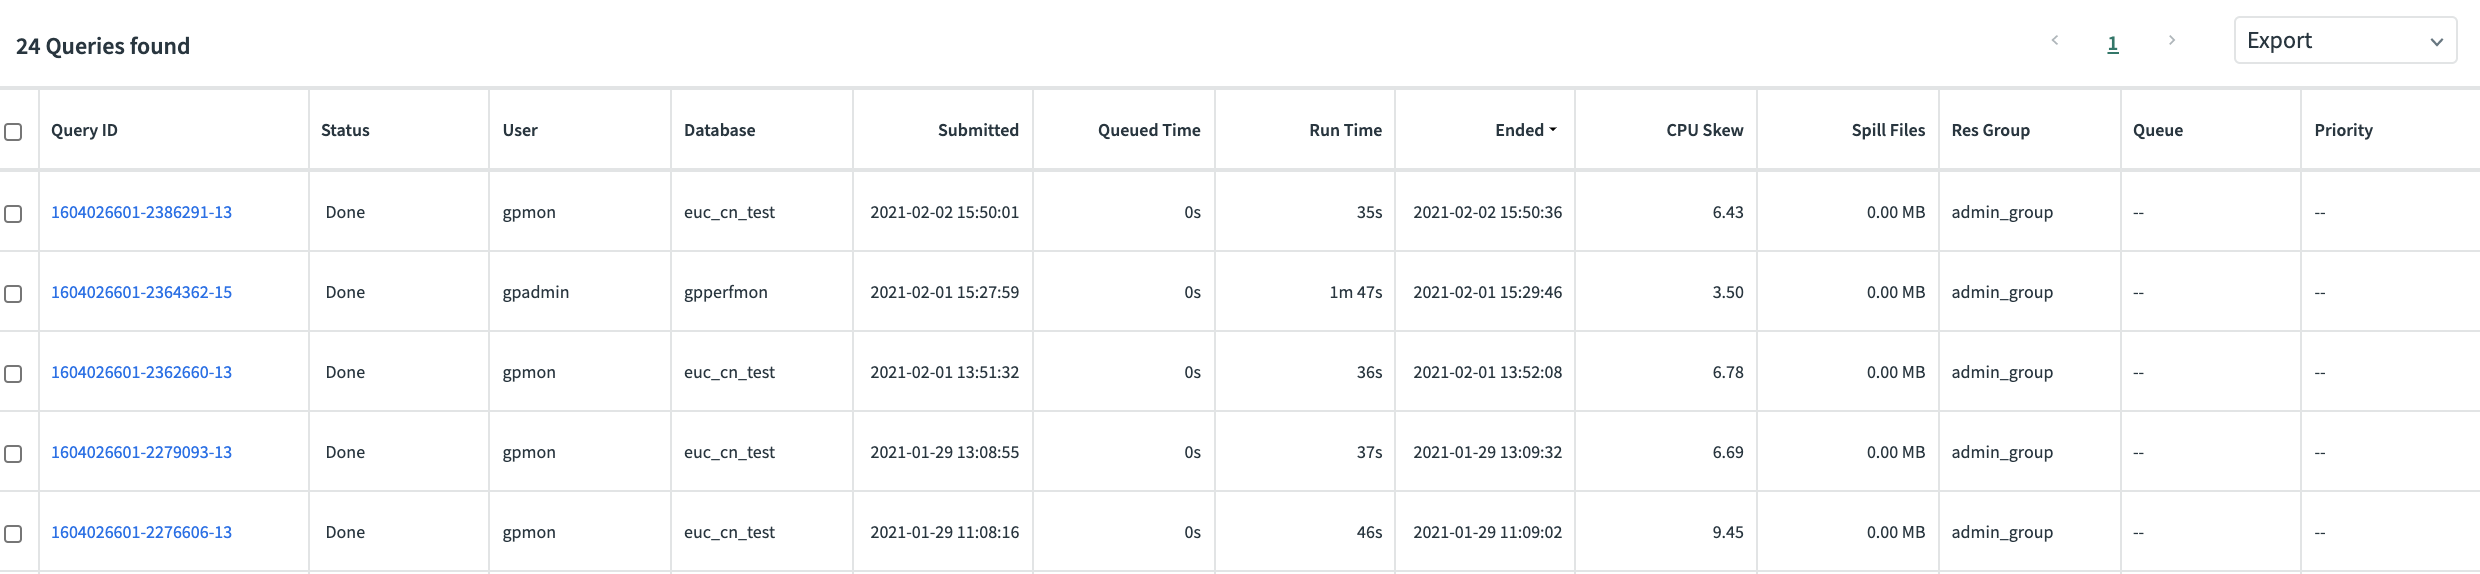
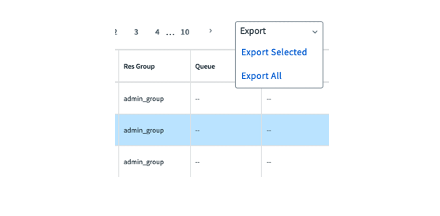
To export any selected query information, or the whole table, use the Export dropdown at the top right of the table:
The Queries results table has the following columns:
Query ID
An identification string for the query. In the Console, this looks like “1295397846-56415-2”.
Status
The final status of the query: Done, Cancelled, or Error.
User
The VMware Greenplum user who submitted the query.
Database
The name of the database that was queried.
Submitted
The time the query was submitted to the query planner.
Queued Time
The time the query waited before it was executed. In addition to time in the queue, this includes other time such as time in the optimizer.
Run Time
The amount of time the query required to produce a result.
Ended
The time the query completed or was cancelled.
CPU Skew
The amount of CPU skew. CPU skew occurs when query executor processes for one segment use a disproportionate amount of CPU compared to processes for other segments executing the query. This value is the coefficient of variation for the CPU used by processes running this query on each segment, multiplied by 100. For example, a value of .95 is shown as 95.
Spill Files
The total size of spill files created for the query. VMware Greenplum creates spill files when there is insufficient memory to execute the query in memory. See Managing Spill Files Generated by Queries for information about spill files.
Res Group or Res Queue
The name of the resource group or resource queue for the query. For more information about Resource Queues, Resource Groups, and Query Plans, see the VMware Greenplum administration documentation.
Priority
(Res Queue only) A query executes with the CPU priority assigned to its resource queue.
Select one of the query links to move to the Query History Details dashboard, which includes details about the query metrics, the query text, and the query plan and execution statistics for that query.
