


The Query History Details view displays query metrics, the query text, query tags, information about inner queries, the query plan and progress, and the tables the query accessed for a single query selected from the Query History view.
Query History Metrics
The Query ID, execution status, and run time of the query are displayed at the top.
The following metrics are displayed for the query. Under the Details heading:
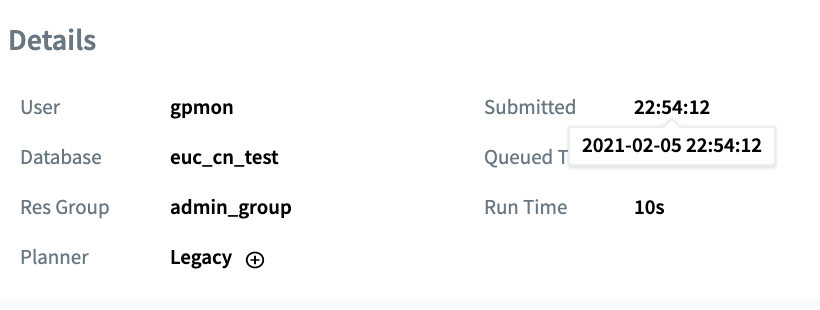
User
The VMware Greenplum role that submitted the query.
Database
The name of the database that was queried.
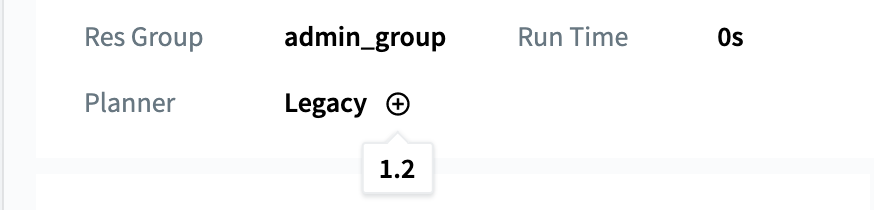
Res Group / Res Queue
The name of the resource group or resource queue that is managing the query.
Planner
The name of the query planner used for this query, GPORCA or Legacy. Press the “+” to see the cost of the query, and copy using the mouse.
Submitted
The time the query was submitted to the query planner. Hover over the submitted time to view the submitted date.
Queued Time
The time the query waited before it was executed. In addition to time in the queue, this includes other time such as time in the optimizer.
Run Time
The amount of time the query executed.
Under the Performance heading, the metrics indicate the final state of the query before it ends:
CPU Coordinator
The CPU percent on the VMware Greenplum coordinator host for this query.
CPU Segments
CPU percent average for all segment processes executing this query. The percentages for all processes running on each segment are averaged, and then the average of all those values is calculated to render this metric. The coordinator and standby coordinator are excluded from the calculation.
CPU Time
Total CPU time consumed by all processes on all segments executing this query.
CPU Skew
The amount of CPU skew. CPU skew occurs when query executor processes for one segment use a disproportionate amount of CPU compared to processes for other segments executing the query. This value is calculated as 1 − (average_segment_CPU / maximum_segment_CPU)
Peak Memory
The maximum amount of memory consumed by all segment processes executing the query. For queries that ran before version 6.7/4.15 of Command Center, this metric will display “–”, as peak memory was not collected at that time.
Spill Files
The total size of spill files created for the query. VMware Greenplum creates spill files when there is insufficient memory to execute the query in memory. See Managing Spill Files Generated by Queries for information about spill files.
Disk R
The total disk read rate for all segment hosts.
Disk W
The total disk write rate for all segment hosts.
Locks and Blocks
Contains lists of queries blocked by locks this query holds, and queries held by other transactions that block this transaction. Click a list to expand and view the contents.
Query Text and Execution Plan
The query text and the query’s plan and execution progress are shown in the lower panels of the Query Details view. The text of the query is displayed in the left panel, and the plan and progress is displayed in the right panel. The plan is available only for queries that ran for at least ten seconds.
Query Text
The Query Text panel displays the text of the query as it was submitted to VMware Greenplum.
Command Center can display up to 100K characters. If you click COPY, up to 100K characters of the query text are copied to the clipboard.
If the query text is longer than 100K characters, a message is displayed with a link you can use to download the full text of the query. The name of the text file is the ID of the query with a .txt extension. The file is available to download for 24 hours.
Query Plan and Progress
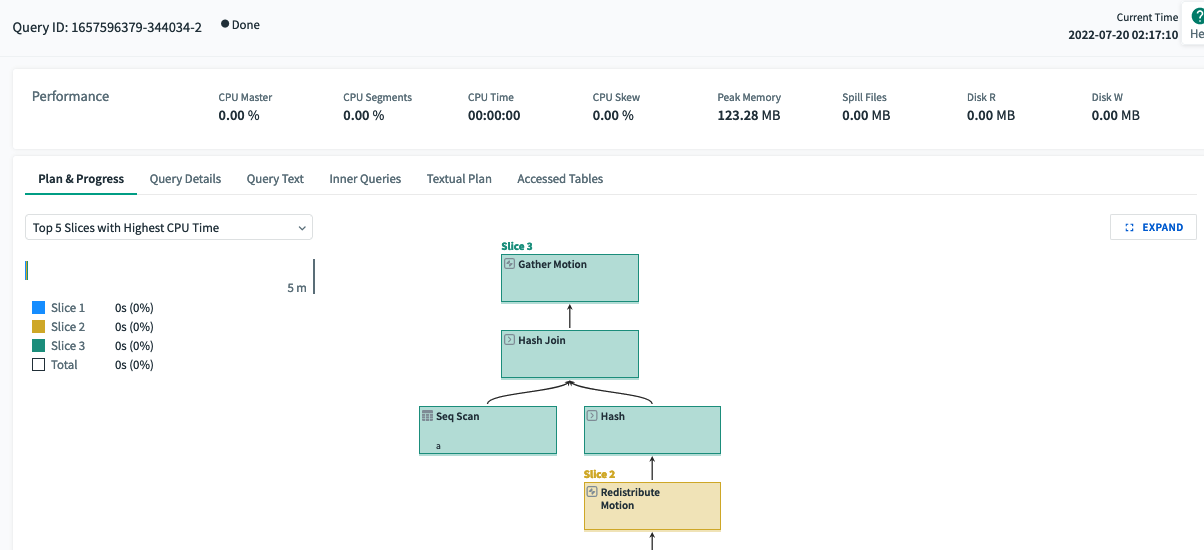
The Plan & Progress tab in the lower right panel is a graphical representation of the query plan with metrics to show the planned and actual query execution. Each box in the tree represents a step in the query execution plan. The boxes are labeled with the operation they represent. Query execution begins at the bottom of the tree and ends at the top.
Query execution plans are executed in “slices,” portions of the query plan that segments can work on independently in parallel. The plan is sliced wherever a data motion operator occurs. The time displayed in the upper right corner of each box is the amount of CPU time used for all steps in the slice to which the step belongs. Each slice is displayed in its own color, making it easy to distinguish the slices from each other. The visual query plan does not illustrate slices, but you can find information about slices in the textual plan.
If you click a step, the box expands to show additional details.
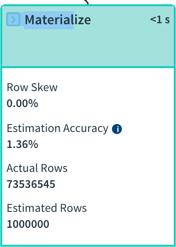
The expanded plan box contains the following metrics.
- The type of operator. When the operator is a table scan, the name of the scanned table is included. See Query Plan Execution for descriptions of the operators.
- Information related to the current operation, such as the hash key, merge key, join condition, or filter condition.
- Row Skew - the amount of row skew for the current operator, a value from 0% to 100%. Row skew occurs when some segments process more rows than other segments. The percentage is calculated as
(1 − (average_segment_rows / maximum_segment_rows)) * 100. Nodes with a row skew of greater than 30% are marked with an exclamation point. - Estimation Accuracy - a percentage calculated from the estimated rows the node would produce and the actual rows the node produced when the query executed. The percentage is calculated as
min(estimated_rows, actual_rows) / max(estimated_rows, actual_rows) * 100 - Actual Rows - The number of rows produced by this step.
- Estimated Rows - The estimated number of rows the operator will produce.
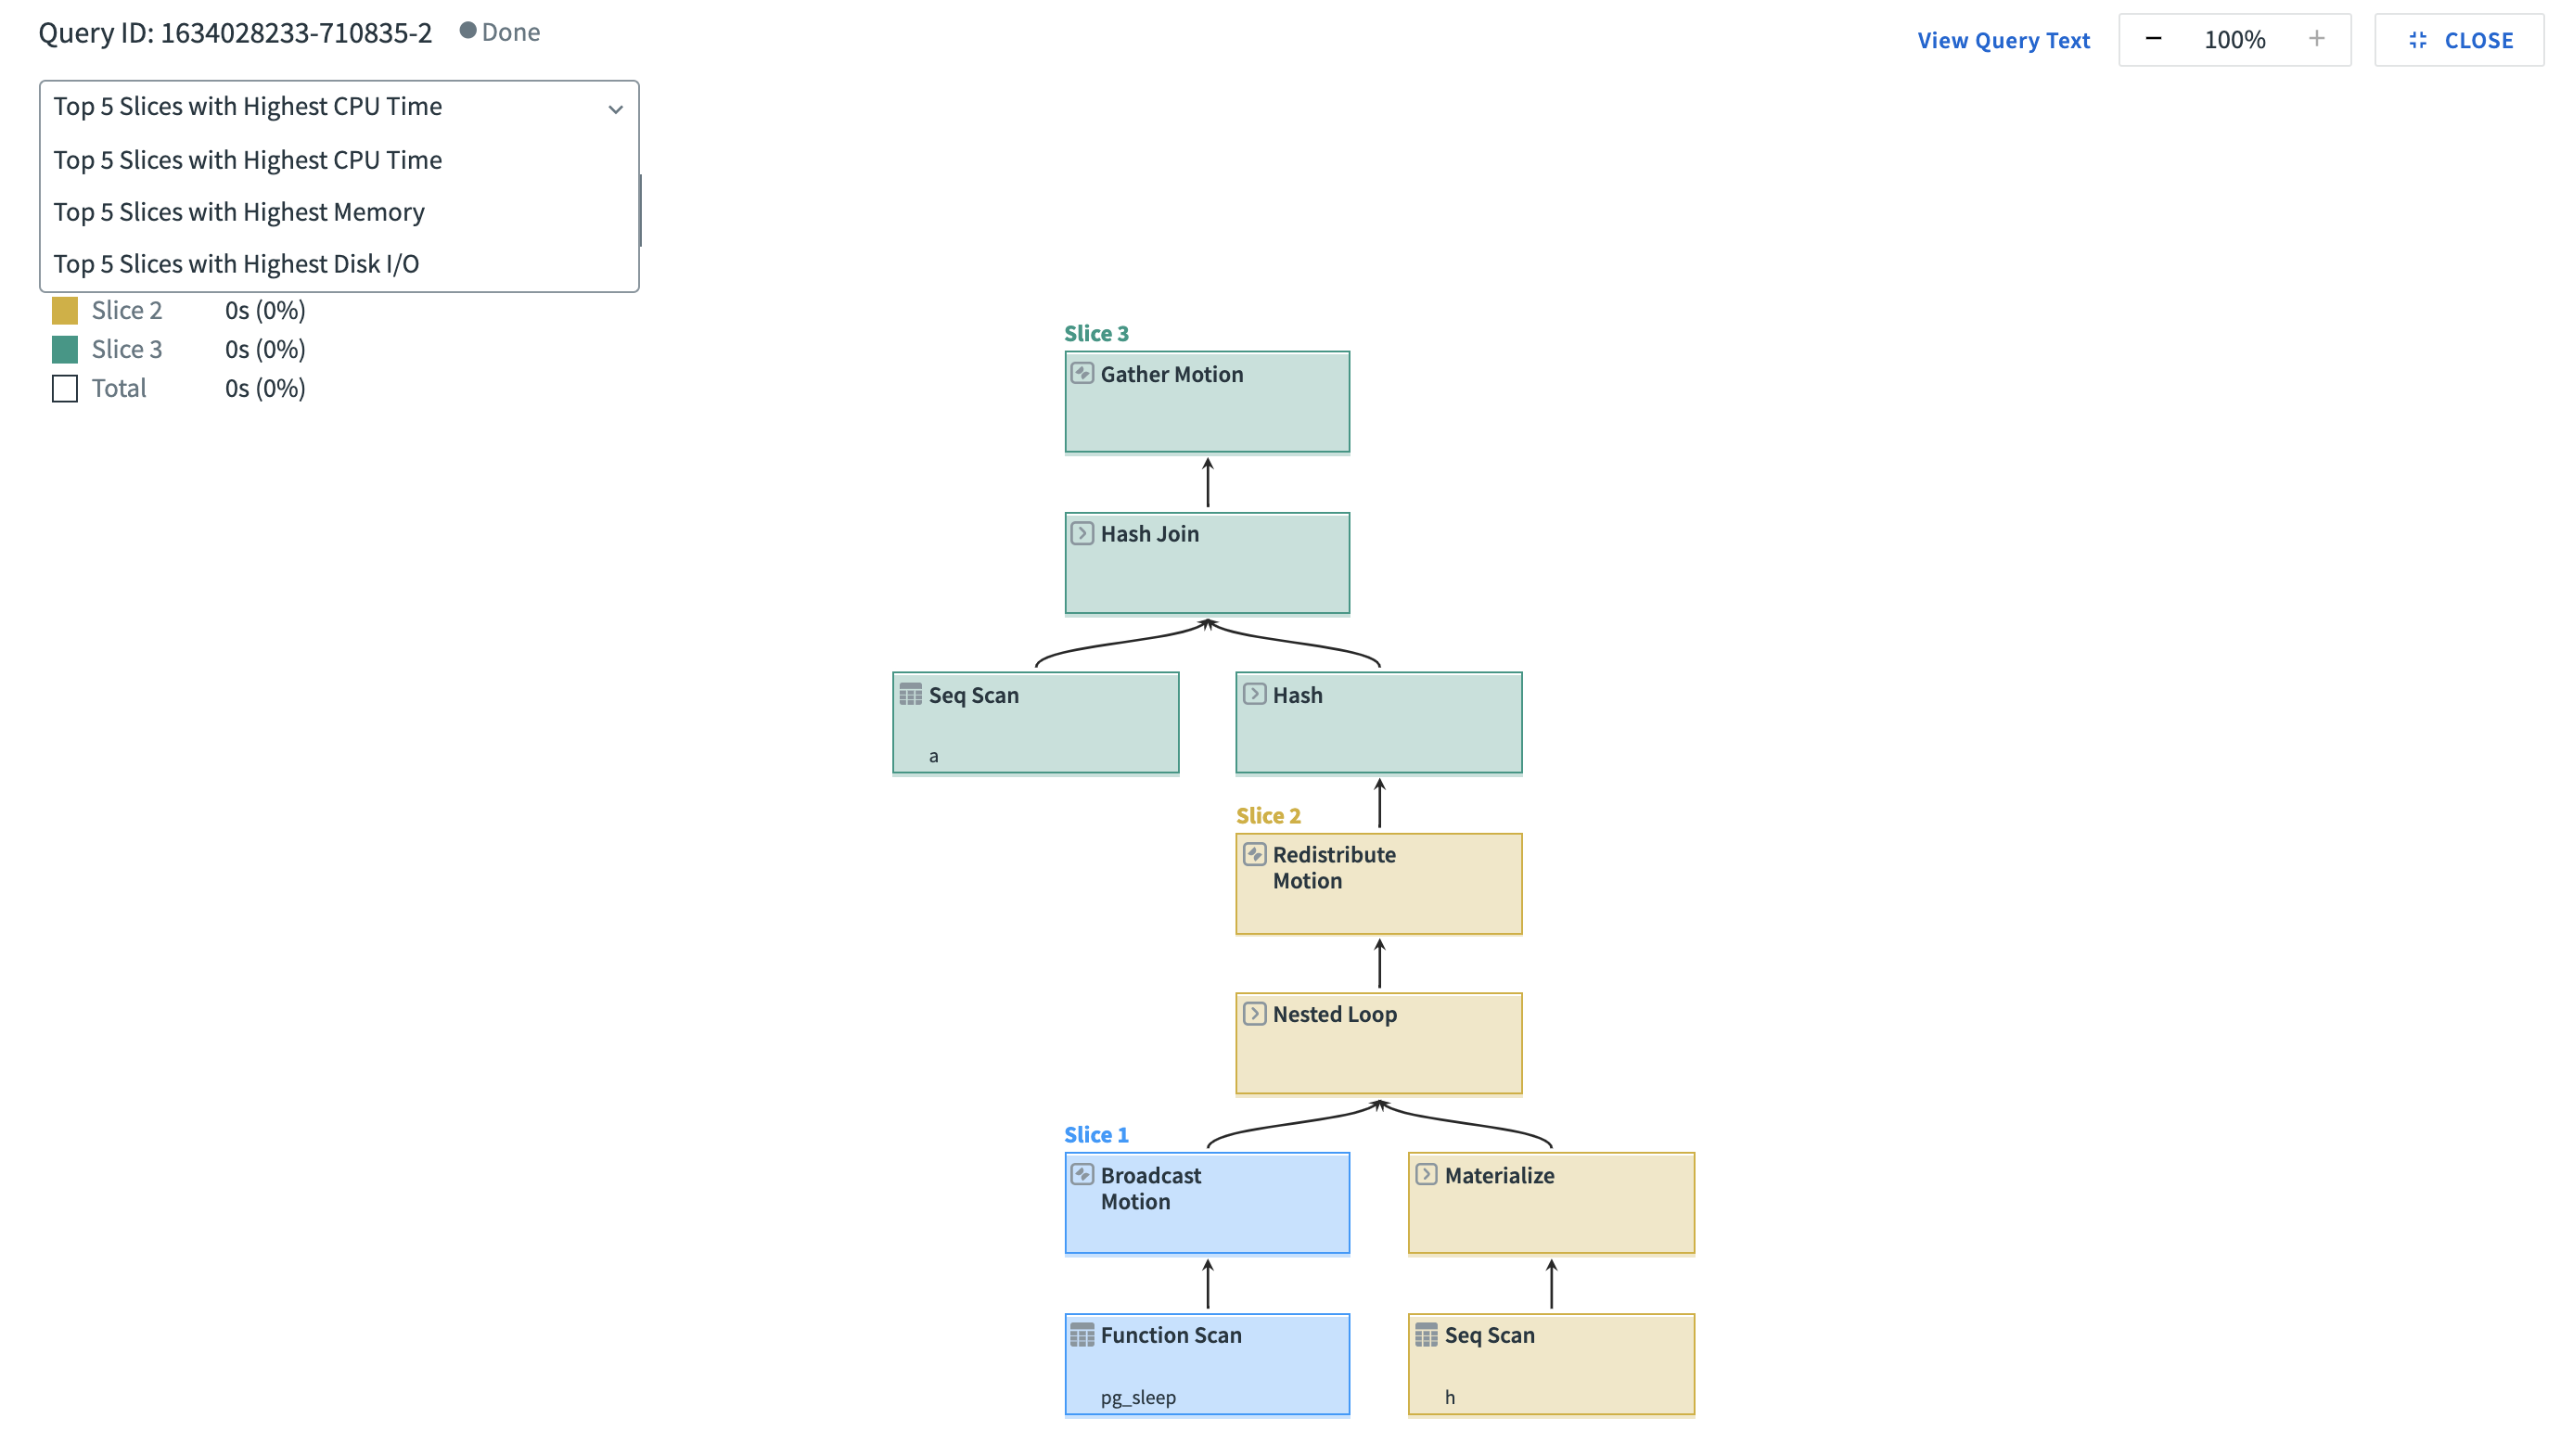
Display Slice Metrics
From within the Plan and Progress tab you may display key metrics about slices, including:
- the top 5 slices that consume the most CPU time
- the top 5 slices that consume the most memory
- the top 5 slices that use the most disk I/O
To display this information, click the Expand button on the far right. This displays a screen with a dropdown menu from which you can choose which slice metrics you want to display:
Textual Plan
Select the Textual Plan tab and click RUN EXPLAIN to generate the text representation of the explain plan. The EXPLAIN command is run against the current state of the database, so the plan generated may differ from the the plan used when the query executed.
Note: The RUN EXPLAIN button is dimmed if Command Center is unable to generate the explain plan. Command Center is unable to generate the explain plan if the size of the query text is greater than 100K characters or if the query text contains multiple statements.
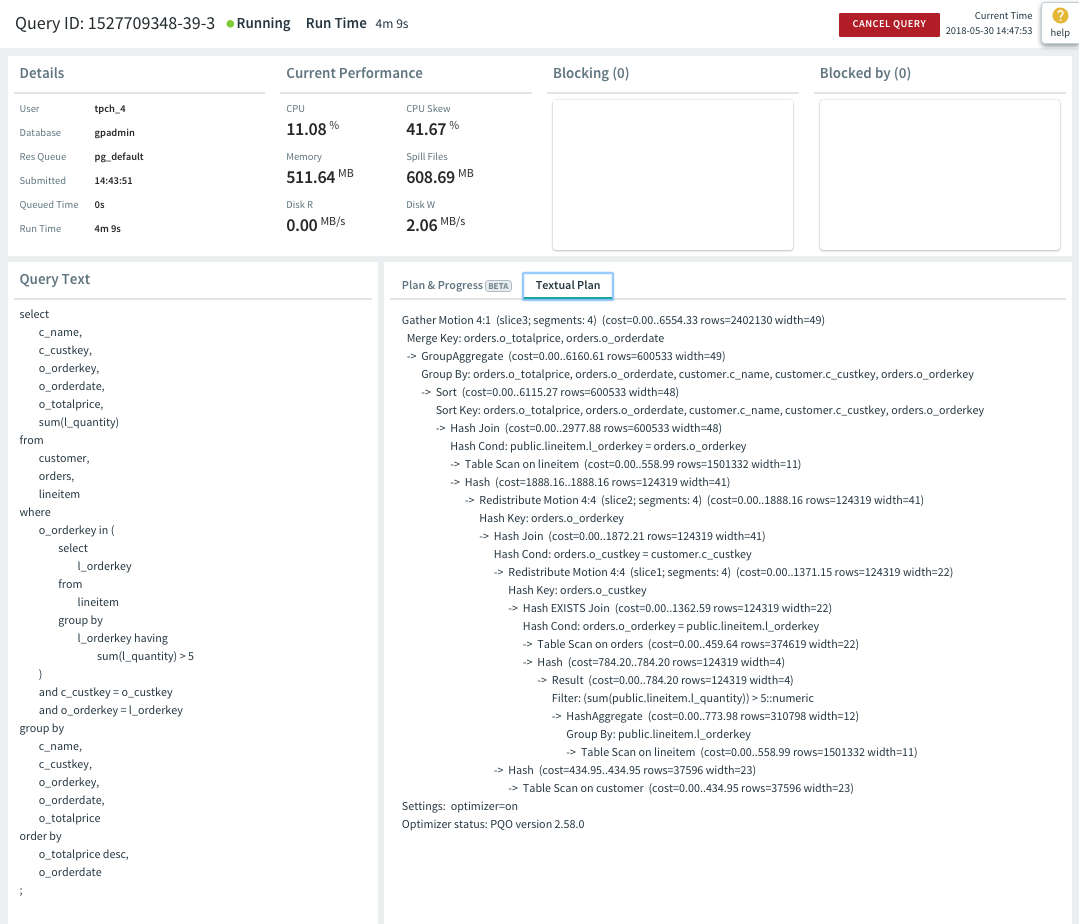
The textual plan is the output of the VMware Greenplum EXPLAIN command for the query. The query plan steps are labeled with arrows (->) and the structure of the query plan tree is indicated with indentation.
The Optimizer status: line at the bottom of the textual plan reports whether the explain plan was generated using the GPORCA optimizer (PQO) or the legacy query optimizer.
For help reading the textual explain plan see the EXPLAIN command in the Vmware Greenplum reference documentation and Query Profiling in the VMware Greenplum administration documentation. See Query Execution for descriptions of the query operators.
Accessed Tables
The Accessed Tables panel displays the tables this query accessed.
