Command Center users with Basic permission can view details about the tables in a VMware Greenplum.
-
Select Table Browser to view the Command Center Table Browser.
-
On the Table Browser view, choose a database and then use the dropdown to select a schema. All filter criteria except Database are optional.
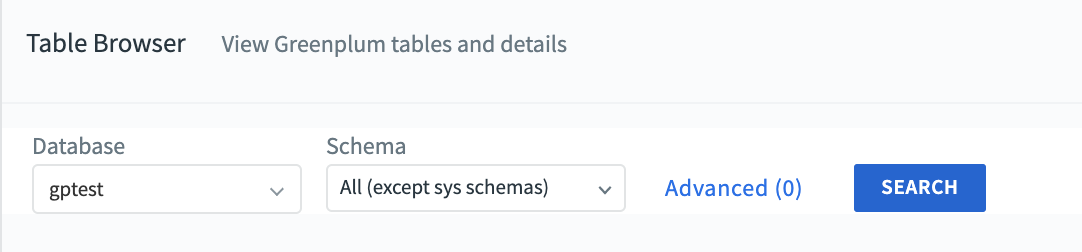
Database
Select the name of the database to browse.
Schema
Enter the name of a schema to select only the tables that belong to that schema. The default is “All (except sys schemas)” where system schemas include:
pg_catalog,pg_toast,pg_bitmapindex,pg_aoseg,information_schema, orgp_toolkit. -
Click Advanced to display more search criteria for the database and the schema you have selected.
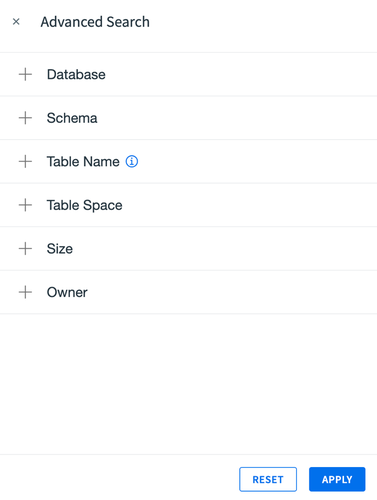
Table Name
Enter the table name for your search. You may enter a
%wildcard to match any characters.Table Space
Select the table space from the dropdown options.
Size
To select tables by size, select a ≤ (less than or equal) or ≥ (greater than or equal) operator, and enter a size number with a size unit (KB, MB, GB, TB).
Owner
Select one or more role names to select only tables owned or not owned by the role.
-
Click SEARCH to display tables matching the criteria you have entered.
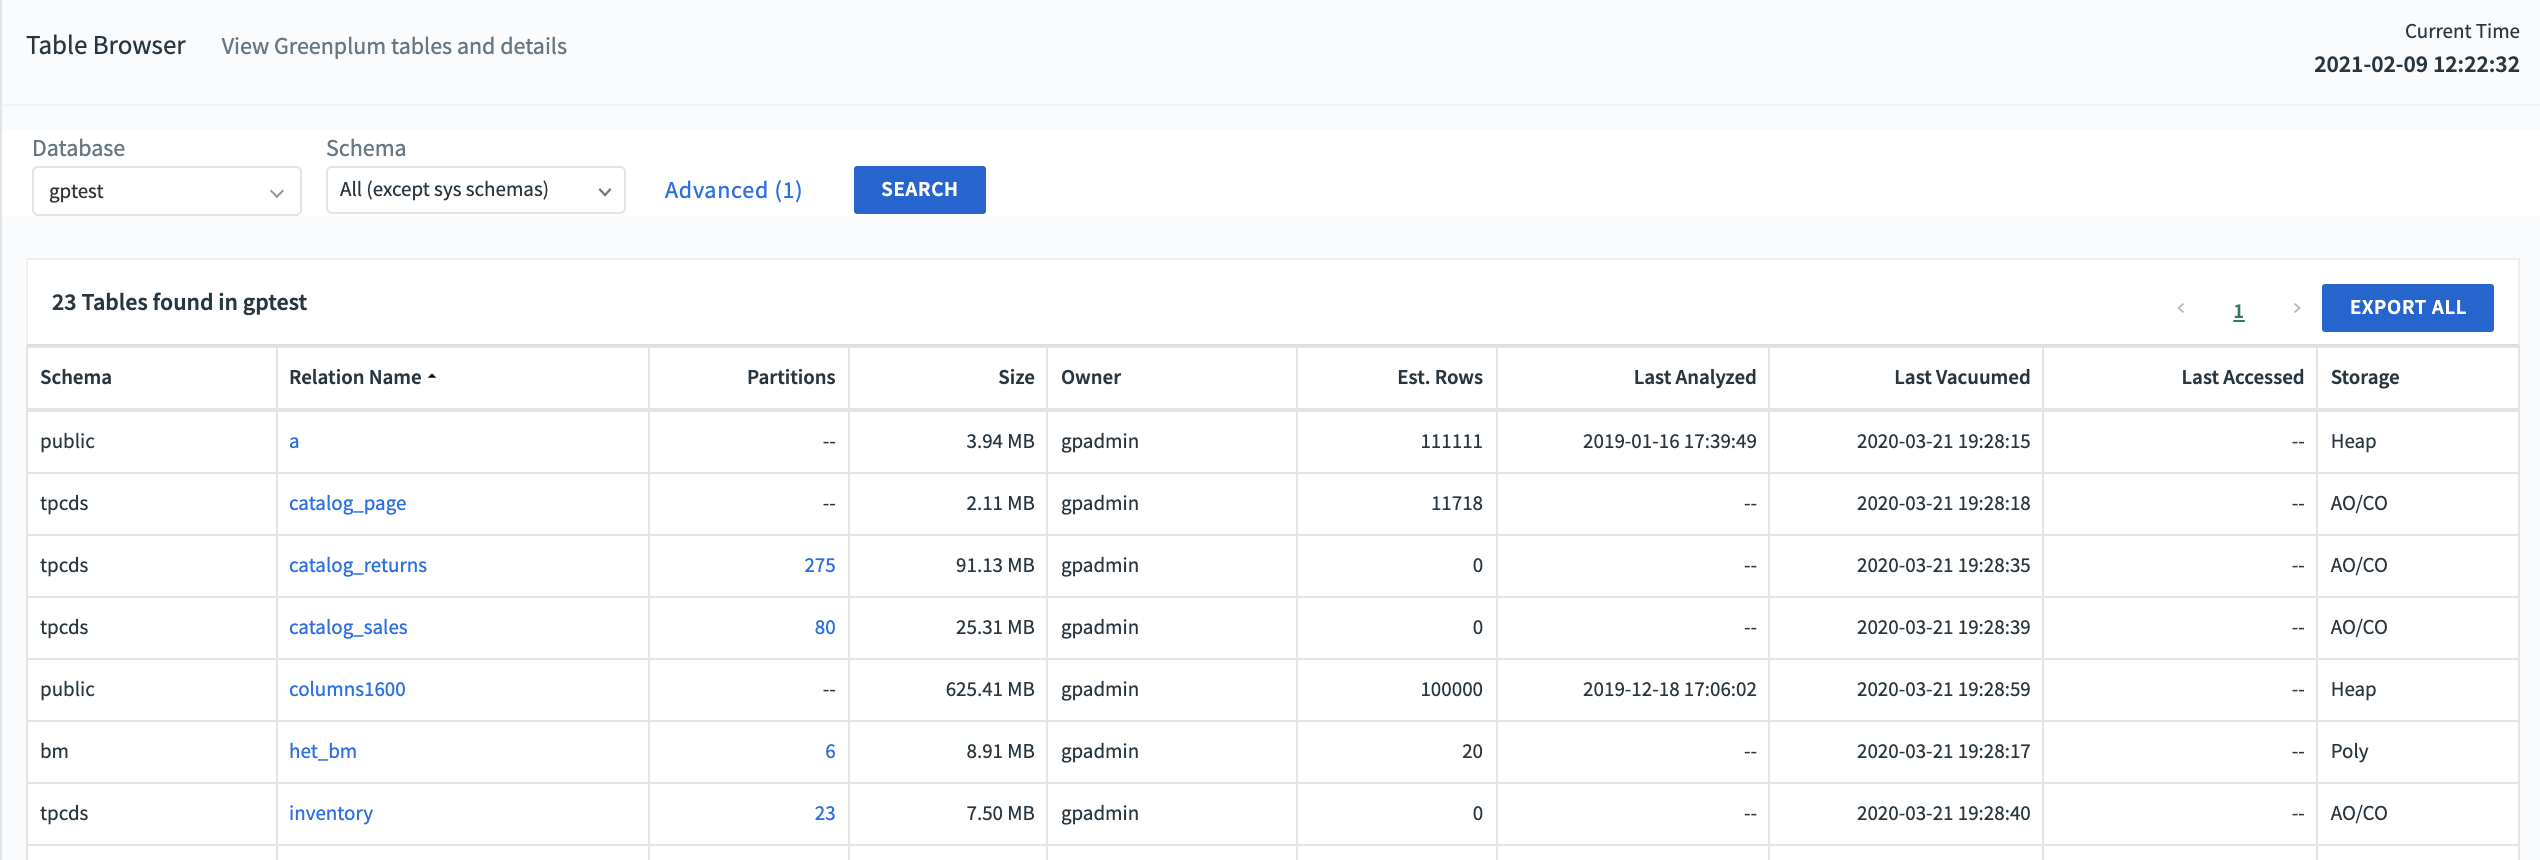
Table Browser statistics are updated every 300 seconds by default. Activity that occurs between updates is not displayed in the Table Browser view until Command Center updates the table statistics at the end of the sampling interval. This means that, for example, it can take up to five minutes for a new table to appear in the Table Browser. The times displayed for
Last Analyzed,Last Vacuumed, andLast Accessedare the time that Command Center updates the table statistics after the event has been detected, not the actual time of the event. The actual event could have occurred at any point in the previous five minutes (or in the time period specified bystats_check_interval, if you have modified the parameter).You can change the sampling interval by setting the
stats_check_intervalparameter in the$GPCC_HOME/conf/app.confconfiguration file. Restart Command Center after updating the configuration file. See Command Center Console Parameters for more information about theapp.conffile.Note: using the
gppersistentrebuildutility might refresh theLast Accessedtable data even if the table has not been accessed by a query. -
Click the EXPORT ALL button, at the top right of the table results, to save the search results in a local file. The file is created in the background and when the export is ready, a notification is entered at the Notifications center, with a link to a CSV file, similar to:
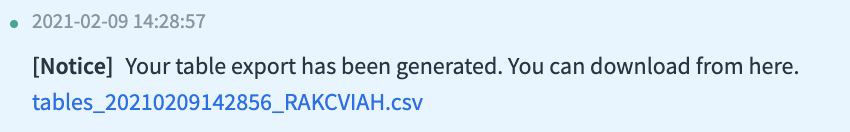
If the export operation is greater than 1 million rows, an alert is raised.
You can change the sampling interval by setting the stats_check_interval property in the $HOME/gpmetrics/gpcc.conf configuration file. Restart Command Center after updating the configuration file. See the gpmetrics Configuration File Reference for more information about the gpcc.conf file.
Table List
The Table Browser table list displays these columns:
Schema
Name of the schema the table belongs to.
Relation Name
Name of the table.
Partitions
Total number of leaf partitions. If the table has no partitions, this column contains 0.
Size
Combined size of the table’s files on all segments. If a table has partitions, then the size of its partitions are added to the table size.
Owner
Database role name of the table owner.
Est. Rows
Estimated number of rows in the table. For external tables this column contains 0.
Last Analyzed
Time the table was last analyzed. The actual event occurred at some point during the preceding sampling interval.
Last Vacuumed
Time the table was last vacuumed. (Does not include AUTOVACUUM.) The actual event occurred at some point during the preceding sampling interval.
Last Accessed
Time the table was last accessed. (SELECT, INSERT, UPDATE, DELETE, or TRUNCATE operations.) The actual event occurred at some point during the preceding sampling interval.
Storage
Storage type for the table: Heap, AO, AO/CO, External, or Poly (Polymorphic - used for tables that combine different storage types in a single table).
Table Details
Click the name of a table in the Relation Name column to view details for that table.
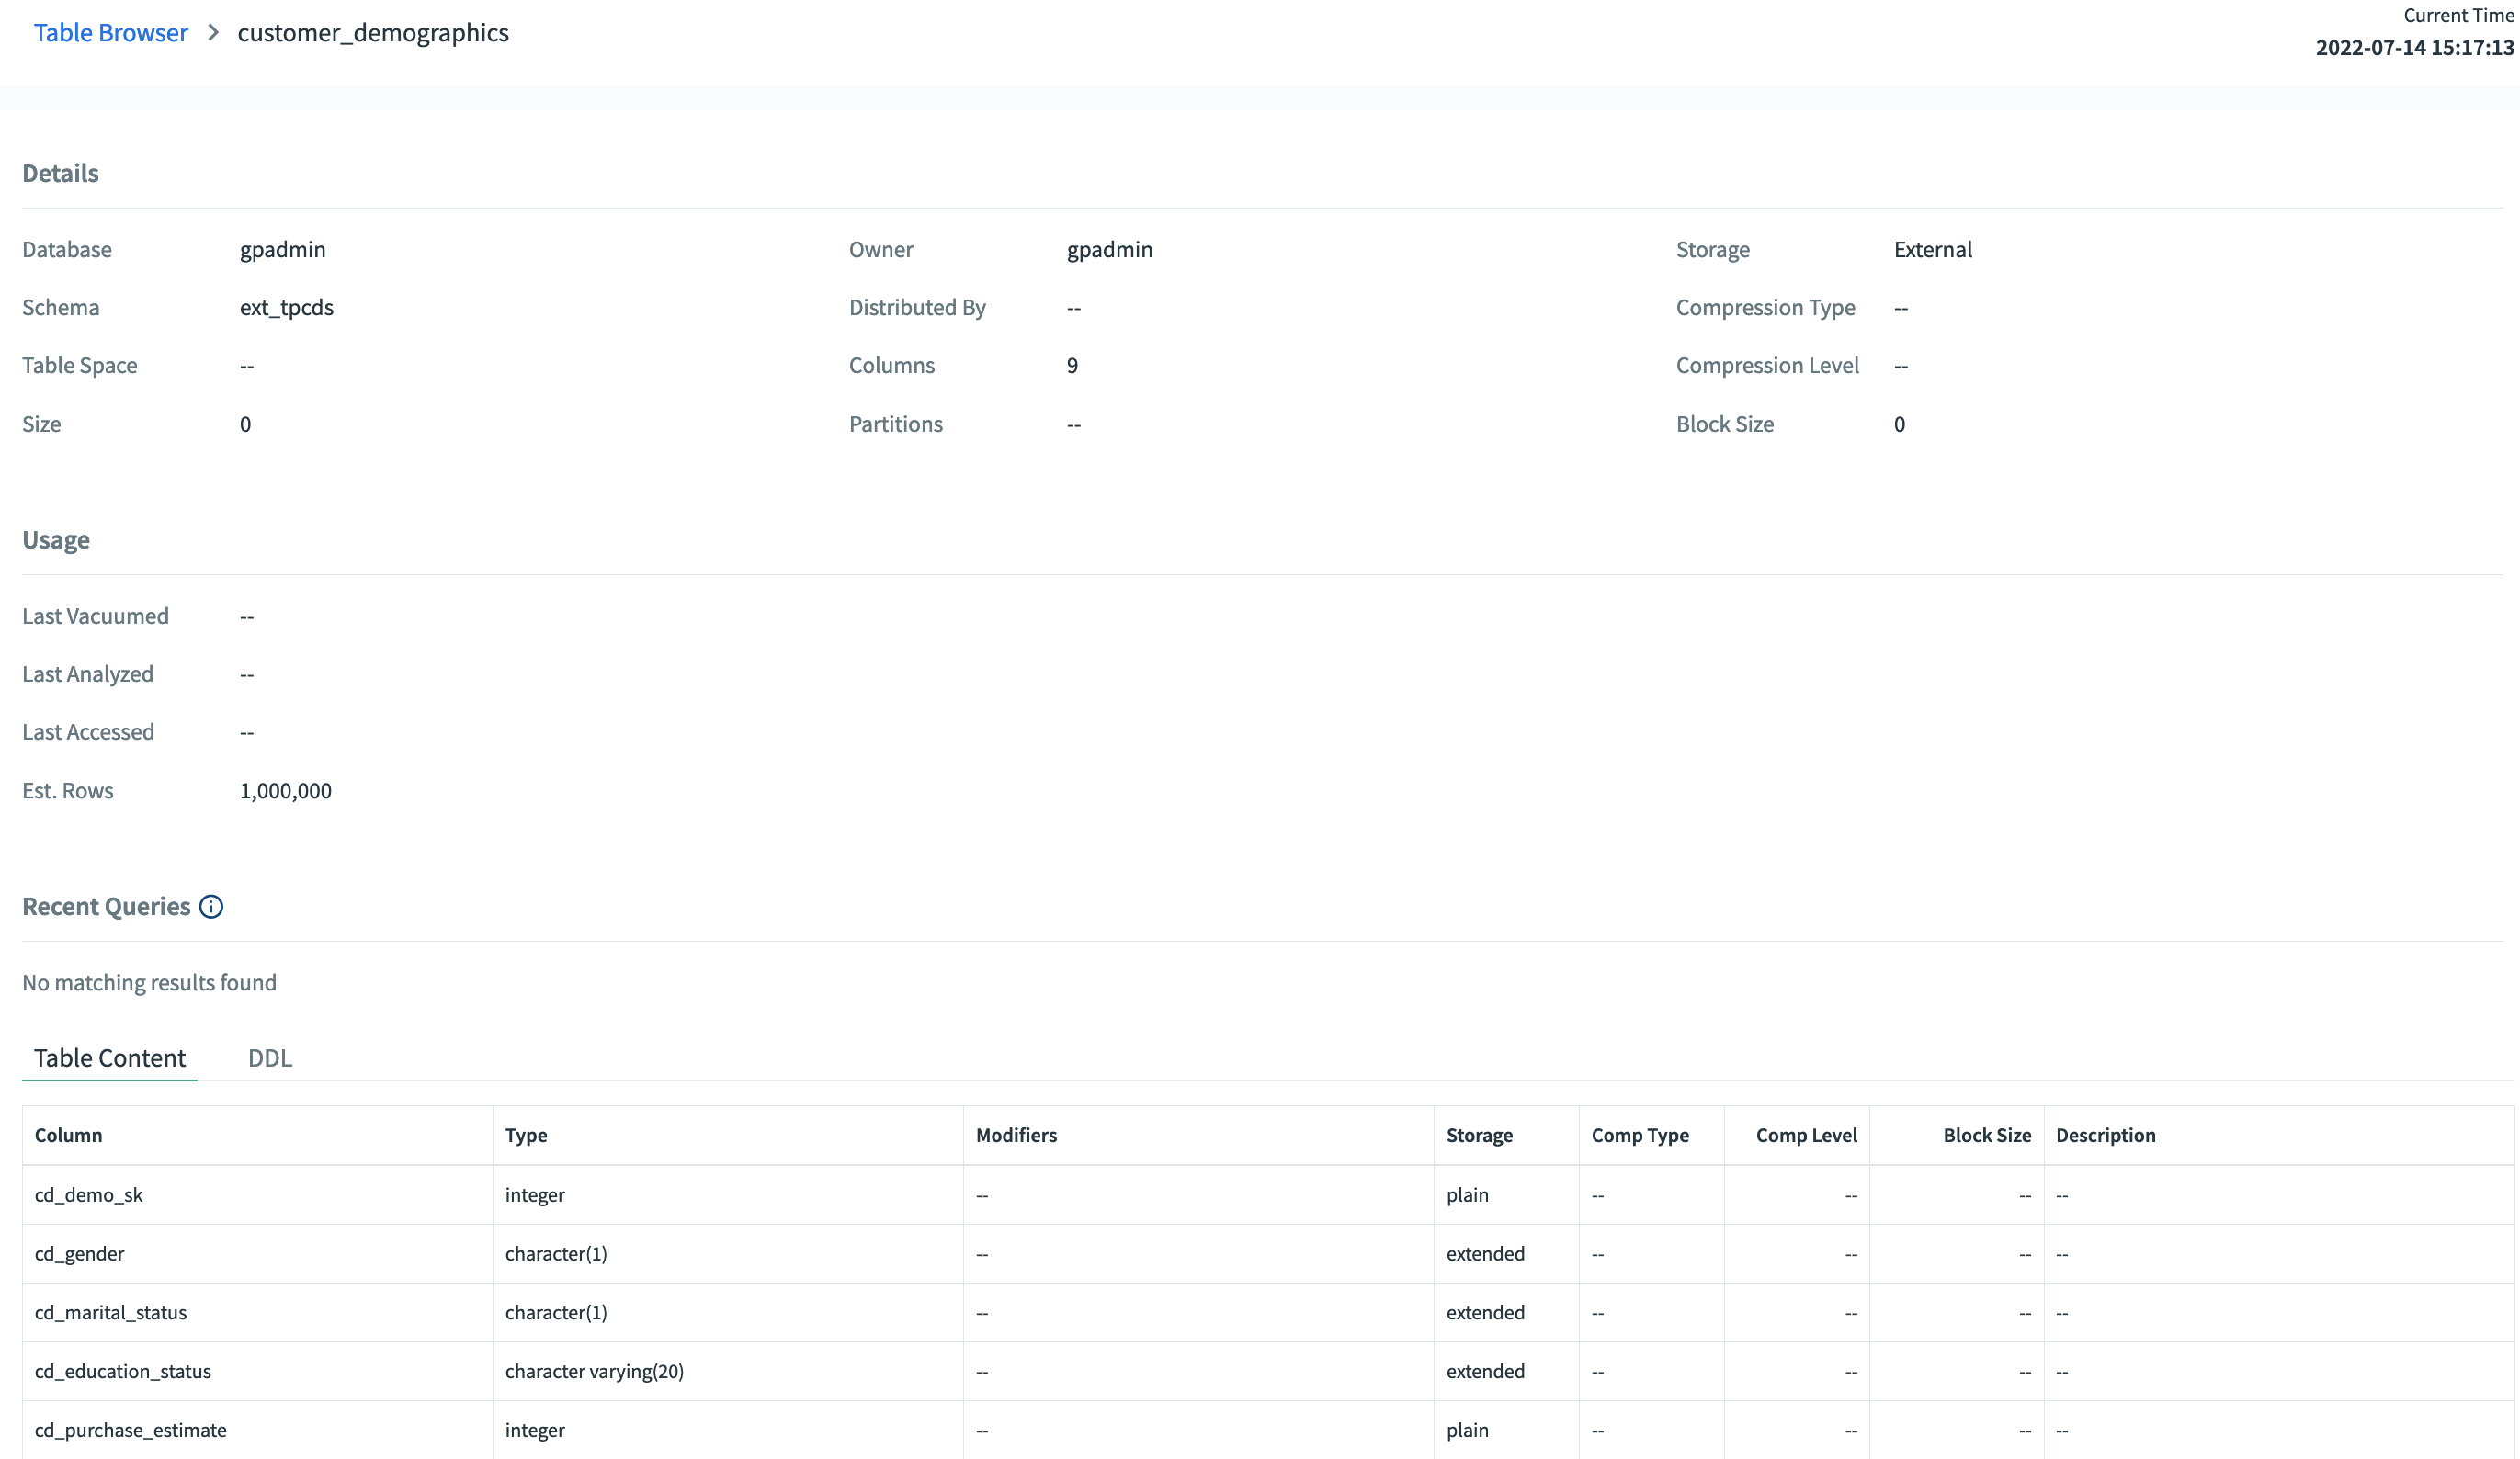
The Table Detail view displays this information:
Name
Name of the table.
Database
Name of the database.
Schema
Name of the schema the table belongs to.
Table Space
Name of the tablespace where the table’s files reside.
Size
The size of the table.
Owner
Database role name of the table owner.
Distributed By
Distribution policy for the table. This can be a list of the distribution key columns (key1, key2, key3, ...), Randomly, or Replicated.
Columns
Number of user columns in the table. System columns are not included in the count.
Partitions
Number of partitions the table has, including middle-level and leaf partitions. Click Show to list up to 100 partitions. The list includes the partition’s name, table size, partition criteria, storage type, and compression parameters. Middle-level partitions are displayed with a different background color.
Storage
Storage type for the table: Heap, AO, AO/CO, External, or Poly (Polymorphic - used for tables that combine different storage types in a single table).
Compression Type
For append-optimized tables, the type of compression used for the table: ZLIB, ZSTD, QUICKLZ, RLE_TYPE.
Compression Level
For append-optimized tables, the level of compression. For ZLIB, the level is 1 (fastest compression) to 9 (highest compression ratio). For ZSTD, the level is 1 (fastest compression) to 19 (highest compression ratio). For QUICKLZ, the level is 1. For RLE_TYPE the compression level is 1 (fastest compression) to 4 (highest compression ratio).
Blocksize
Size, in bytes, for each block in the table: 8k, 16K, 1M, or 2M.
Usage Section
Last Analyzed
Time the table was last analyzed.
Last Vacuumed
Time the table was last vacuumed. (Does not include AUTOVACUUM.)
Last Accessed
Time the table was last accessed. (SELECT, INSERT, UPDATE, DELETE, or TRUNCATE operations.)
Est. Rows
Estimated number of rows in the table.
Recent Queries Section
This section lists the five most recent queries in the query history to access the table. The list is limited to queries that executed in the last 30 days and that ran for ten seconds or more.
Click a Query ID to view the Query History Details for the query.
Table Contents Tab
A list of the table’s columns, types, constraints, and compression types.
Column
Name of the column.
Type
Data type of the column.
Modifiers
Constraints defined for the column.
Storage
Storage type for the column. Plain is for fixed-length values such as integer and is inline, uncompressed. Main is for inline, compressible data. Toast is for data that exceeds the size of a data block and is stored in chunks in a separate table associated with the user table. Extended is for external, compressed data. Extended is the default for most data types that support non-plain storage.
Compression Type
The type of compression used for the column: none, ZLIB, ZSTD, QUICKLZ, RLE_TYPE.
Compression Level
The level of compression.
For ZLIB, the level is 1 (fastest compression) to 9 (highest compression ratio).
For QUICKLZ, the level is 1.
For ZSTD, the level is 1 (fastest compression) to 19 (highest compression ratio).
For RLE_TYPE the compression level is 1 (fastest compression) to 4 (highest compression ratio).
Blocksize
Size, in bytes, for each storage block.
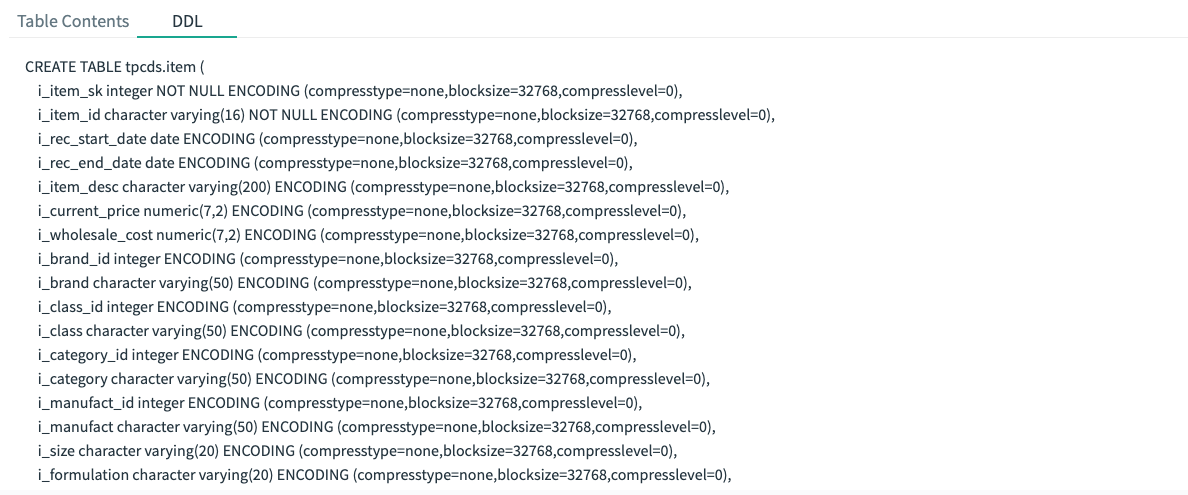
DDL Tab
Click the DDL tab to display the CREATE TABLE statement for the table.