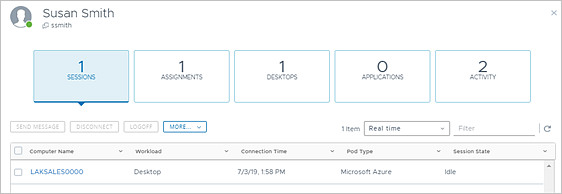
Use the Administration Console's user card feature as a dashboard to work with a specific user's assigned resources, such as that user's desktops.
You use the Administration Console's search feature to display the card for a specific user. See Using the Console's Search Feature for how to search for a user. When you click on a user in the search results, that user's card is displayed.

Use the tabs at the top of the user card to work with those items in your environment that are related to that user.
| User Card Tabs | Description |
|---|---|
| Sessions | Lists current and historical user sessions, aggregated from all of your cloud-connected pods. Provides actions you can perform on the listed sessions. For details about these actions, see Actions You Can Take on Sessions. By default, only current sessions are shown.
Note: Since by default current sessions are shown, the Sessions tab will show a value of 0 at the top when there is no current session. When you adjust the display to show historical data, this number is updated to the number of sessions in the selected period.
Click on a session to open its dashboard. From a session's dashboard, you can monitor the user session for troubleshooting. See Working with the Session Dashboard. |
| Assignments | Lists the user's assignments.
Note: URL redirection customization assignments are not listed in the user card.
Note: When a user is entitled to a dedicated VDI desktop assignment, but has not yet launched the desktop for the first time, that assignment appears on the
Assignments tab. However, after the user's first launch of the desktop, the system removes it from the
Assignments tab's list and displays it on the
Desktops tab.
|
| Desktops | Lists the user's:
Note: The system assigns a VDI dedicated desktop to a user in one of two ways:
On this tab, you can use the standard virtual machine (VM) action buttons to perform actions on the desktops' underlying virtual machines. |
| Applications | Lists the user's entitled remote applications. |
| Activity | Displays the user's activity for selected time periods. |
Actions You Can Take on Sessions
The available actions you can take on a listed session vary based on the type of session and the permissions of the administrator.
| Action | Description | VDI Desktop | Session-based Desktop |
|---|---|---|---|
| Send Message | Send a message to the logged-in user. When sent, the message appears on the user's screen. | Yes | Yes |
| Remote Assistance | Initiate a remote assistance session. | Yes | Yes |
| Restart | Restart the VM. | Yes | |
| Disconnect | Disconnect the session. | Yes | Yes |
| Logoff | Log the user off the session. | Yes | Yes |
| Reset | Reset the VM. | Yes |
Working with the Session Dashboard
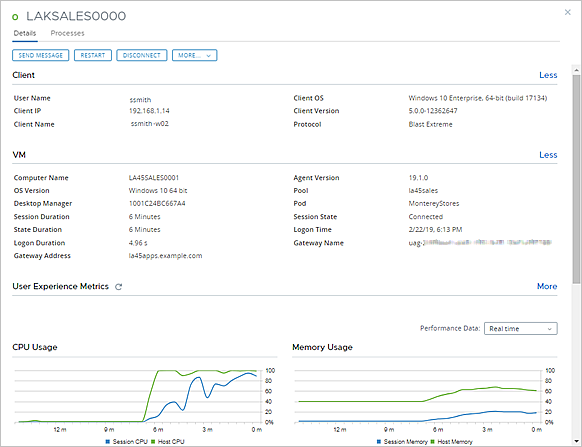
When you click one of the active sessions listed on the user card's Sessions tab, the dashboard for that session is displayed. This dashboard has tabs Details and Processes.
- Details tab
-
The Details tab provides data about various session-related details that can be used to monitor the end user's session for troubleshooting purposes, such as CPU usage, memory usage, network latency, disk performance, and so on. Scroll through the dashboard and use the
Less and
More links to change how many details are displayed on the screen.
Note: Limited metrics are available for the RDP protocol. If the active session is using the RDP protocol, fewer metrics are available than for the other supported protocols.
The following screenshot shows an example of some of the types of data and actions that are available in the session dashboard.

The User Experience Metrics area of the Details tab displays performance data and provides actions that super administrators and help desk administrators can use to troubleshoot issues in the session.
- Processes
- The Processes tab lists the processes and applications that are running in the session and provides an End Task button to end a troublesome process or application.
When the Help Desk Feature Is Not Installed in the Desktop or Farm VM
When a VDI desktop VM or farm's RDSH VM is based on an image that does not have the Help Desk feature installed, an information alert is displayed when you open the dashboard for a session connected to that VM.

In this case, the VM's data is not reported. Because the usual data is not available, some of the dashboard areas appear blank or empty for such sessions, such as:
- Most of the data about the client and VM is unavailable.
- The User Experience metrics and charts are empty.
- The Processes tab is empty.
- Refresh icons are not clickable.
- Some of the action buttons, such as the End task button, are not displayed.