


The dashboard includes predefined widgets that you can add to your dashboard.
On the current dashboard, to put your dashboard into the Edit mode, click the  gear icon. In Edit mode, the dashboard displays a list of widgets that you can add to your dashboard. To add widgets to your dashboard, click Add Widgets on the Add Dashboard Widgets form.
The following widgets are available for a dashboard.
Widget |
Description |
|---|---|
Aggregated Statistics |
Displays aggregated statistics data on labs deployed lab templates, VMs, labs delivered, active lab sessions, and total users for a defined period for an organization account. Select the date range to populate the data. |
Bar Chart Display |
Displays total count of various system values for VMs, vApps, labs, entitlements, prepops, and seating in a bar chart format. |
Broadcast Messages |
Lists event broadcast messages. These message are sent to proctors from students about any issues with the labs during an event. |
Cloud OVDC Capacity Usage |
Displays overall organization vDC resource allocations for the organization account. |
Concurrent Users |
Displays a timeline graph of concurrent users. |
Content Migration Tasks |
Displays a table of Content Migration tasks. |
Daily Entitlement Statistics |
Displays a bar chart of entitlements per day. |
Download Entitlement Statistics |
Generates a CSV report of the entitlement statistics. |
Entitlement Duration Statistics |
Time spent on a unique completed entitlement relative to previous 7 days. |
Get Started! Set up your first lab! |
Displays the Get Started! Set up your first lab! panel. |
Help Requests |
Lists active event Help Requests. |
Hourly Entitlement Statistics |
Displays a stacked column graph of entitlements by hour of the day. |
Labs |
Lists total and current lab's count. |
Manage Unresolved Templates/Media |
Lists all unresolved templates,and media. |
Manage Uploads |
View all uploads. |
Notifications |
Displays a table of important notifications. |
Numeric Display |
Lists a configurable container for numeric display of various system values. |
Pie Chart |
A configurable pie chart for display of various system values. |
Popular Labs |
An ordered column graph of popular labs. |
Upcoming Classes |
A table that shows the next 10 upcoming classes. |
Upcoming Classes Resource Usage |
A timeline graph of estimated resource usage for upcoming classes. |
vAppTemplate Placement Statistics |
Pie graphs of vApp template deployment placement statistics. |
vDC Placement Statistics |
Pie graphs of Org vDC deployment placement statistics. |
VMs |
Total and current VMs count. |
Weekly Entitlement Statistics |
A stacked column graph of entitlements per day of the week over a configurable period. |
Weekly Resource Usage |
A stacked timeline graph of concurrent resource usage by the week. |
About the Notifications Widget
The Notifications widget is the most informative and configurable widget.
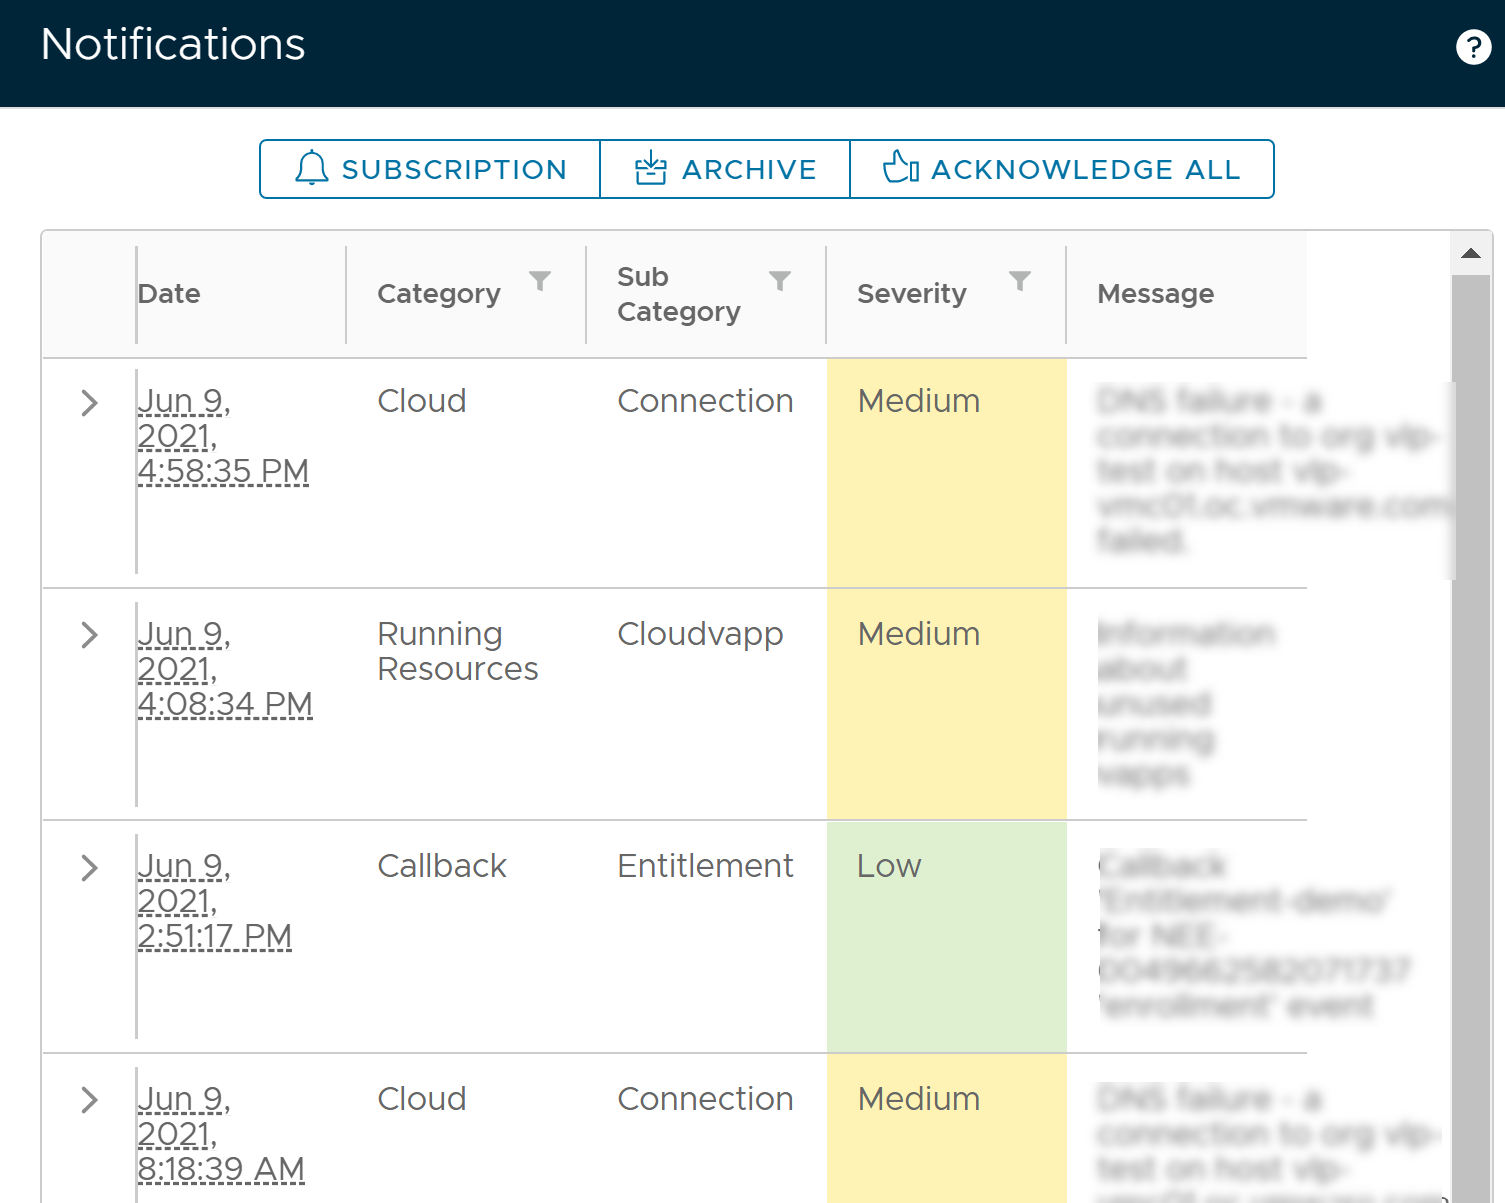
It includes the following features:
Severity Levels: Green (low), yellow (medium), or pink (high).
High severity notifications are related to issues impacting multiple users and often across multiple accounts. Typically, a high severity notification stems from a cloud being unavailable. The pink color highlights the high severity notifications.
The medium severity notifications issue signifies that someone is unable to use the system (examples include failure to the start labs or the errors deploying vApps). The yellow color highlights the medium severity notifications.
Low severity notifications are related to information such as daily summaries. The green color highlights the low severity notifications.
You can sort notifications based on the severity of the notification.
To expand and view the details of a notification, click the Expand arrow.
Notification Subscription: While notifications appear on a dashboard, you can also enable the system to email you the notifications. To open the Notifications Subscription List, click Subscription. From there, you can add an email address and set criteria for which the system must send out notifications. Once you define a subscription, each time a notification that meets your criteria occurs, the system emails it to everyone who has subscribed, and showing it on the dashboard.
Note:In the Notifications Subscription list, severity levels are represented as 1, 2, 3 (1= Pink, 2=Yellow, and 3=Green).
Archive: Displays the Notification Archive List which lists all archived notifications.
Note:The Notification Archive List includes an Export option. To export all notifications to a CSV, Excel, or PDF file, use the Export option.
Acknowledge All: Archives all the notifications. Once you archive a notification, it is not displayed on the dashboard. To view acknowledged notifications, follow the archive link at the top of the page.
View notification categories
Notifications categories are:
Default
Cloud
Administrative
cloud vApp
System
generic task
prepop
callback
billing
cloud template
management
egw
running resources
View notification subcategories
The notifications are also sub categorized to form the following category/subcategory pairings.
administrative, myLearn
cloud, connection
cloud, sync
cloud, task
cloudvApp, ""
genericTask, massUpload
genericTask, task
genericTask, userDownload
genericTask, userMove
prePop, "Daily Summary"
prePop, "provision failure"
system, monitoring
administrative, myLearn
cloud, connection
cloud, deployment
cloud, sync
cloud, task
cloudvApp, ""
genericTask, emailTranscipt
genericTask, massUpload
genericTask, statsDownload
genericTask, task
genericTask, userDownload
genericTask, userMove)
prePop, "Daily Summary"
prePop, "provision failure"
system, cloud
system, monitoring
Download entitlement statistics widget
The Download Entitlement Statistics widget generates a CSV file report of entitlement statistics. The report includes the following information: username, firstName, lastName, company, labId, entitlementId, entitlementStart, entitlementEnd, entitlementComplete, exitCount, totalTime, stepNo, and language.
