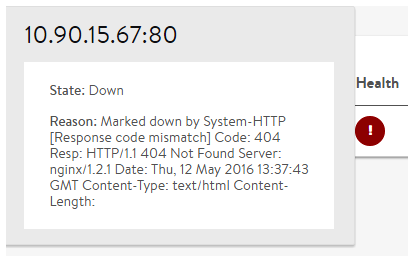
Servers within a pool can have a status of UP, DOWN, or DISABLED (administratively disabled by an administrator). The health monitor determines this status applied to the server pool. NSX Advanced Load Balancer will mark a server DOWN for several reasons.
The reason a server is marked DOWN can be accessed in the following three different ways:
Down Health Score Icon — Hover the mouse over a server's red status icon in the UI.

Down Event — Navigate to the events for the server, the pool, and the virtual service. Expand the event to see the full details. This information can be used to automatically generate an alert and potentially make further system changes. For more information, see Alerts Overview section in VMware NSX Advanced Load BalancerMonitoring and Operability guide.
Server Page — Navigate to . This displays the analytics page for the server.
Note:The Passive monitor is a special type. A passive monitor will not mark a server
DOWN. Instead, if a passive monitor detects bad server-to-client responses, the monitor reduces the percentage of traffic load balanced to that server. Click the plus sign next to the health monitor to show information regarding the server's health status.