


NSX Advanced Load Balancer uses servers to accommodate more workload before load balancing a client to a server. Health monitors perform this function either by actively sending a synthetic transaction to a server or by passively monitoring client experience with the server. NSX Advanced Load Balancer periodically sends transactions, to the active health monitors that originate from the Service Engines hosting the virtual service
Features of Health Monitors
Some features of the Health Monitors in NSX Advanced Load Balancer are as follows:
The health monitors are attached to a pool for a virtual service.
A pool that is not attached to a virtual service will not send health monitors and is considered an inactive configuration.
A pool can have multiple actively concurrent health monitors, such as ping, TCP, and HTTP, and a passive monitor.
All active health monitors must be successful for the server to be marked
UP.
Health check using one virtual service to another virtual service is not possible for virtual service placed in the same SE group.
For more information on SCTP Health Monitor, see Configuring SCTP Health Monitors.
Types of Health Monitors
NSX Advanced Load Balancer supports the following types of health monitors:
Active Health Monitor
Passive Health Monitor
Active Health Monitors
Active health monitors send customer queries to the servers. You can define the send and receive timeout intervals to determine if the server response is successful or failed.
Active health monitors originate from the Service Engines hosting the virtual service. Each SE must be able to send monitors to the servers, which ensures there are no routing or intermediate networking issues that might prevent access to a server from all the active Service Engines. If one SE marks a server up and another SE marks a server down, each SE will include or exclude the server from load balancing according to their local monitor results.
Passive Health Monitor
While active health monitors provide a binary good/bad analysis of server health, passive health monitors provide a more subtle check by attempting to understand and react to the client-to-server interaction. Passive health monitors do not send a check to the servers, instead, NSX Advanced Load Balancer monitors user interaction with the servers. The server must quickly respond with valid responses, such as HTTP 200. If the server is sending back errors, such as TCP resets or HTTP 5xx errors, then the server is assumed to have errors. Errors are defined by the analytics profile attached to the virtual service. The analytics profile also defines the threshold for response time before a server is considered responding slowly.
With active health monitors, NSX Advanced Load Balancer will mark a server DOWN after the specified number of consecutive failures and will no longer send new connections or requests until that the server can correctly pass the periodic active health monitors.
With passive health monitors, server failures will not cause NSX Advanced Load Balancer to mark that server as DOWN. Rather, the passive health monitor will reduce the number of connections or requests sent to the server relative to the other servers in the pool by about 75%. Further failures may increase this percentage.
It is recommended to enable a passive and an active health monitor for each pool.
For more information on the types of health monitors available, see Health Monitor Types.
Setting up a Health Monitor
To view Health Monitors in NSX Advanced Load Balancer, from the UI, navigate to .
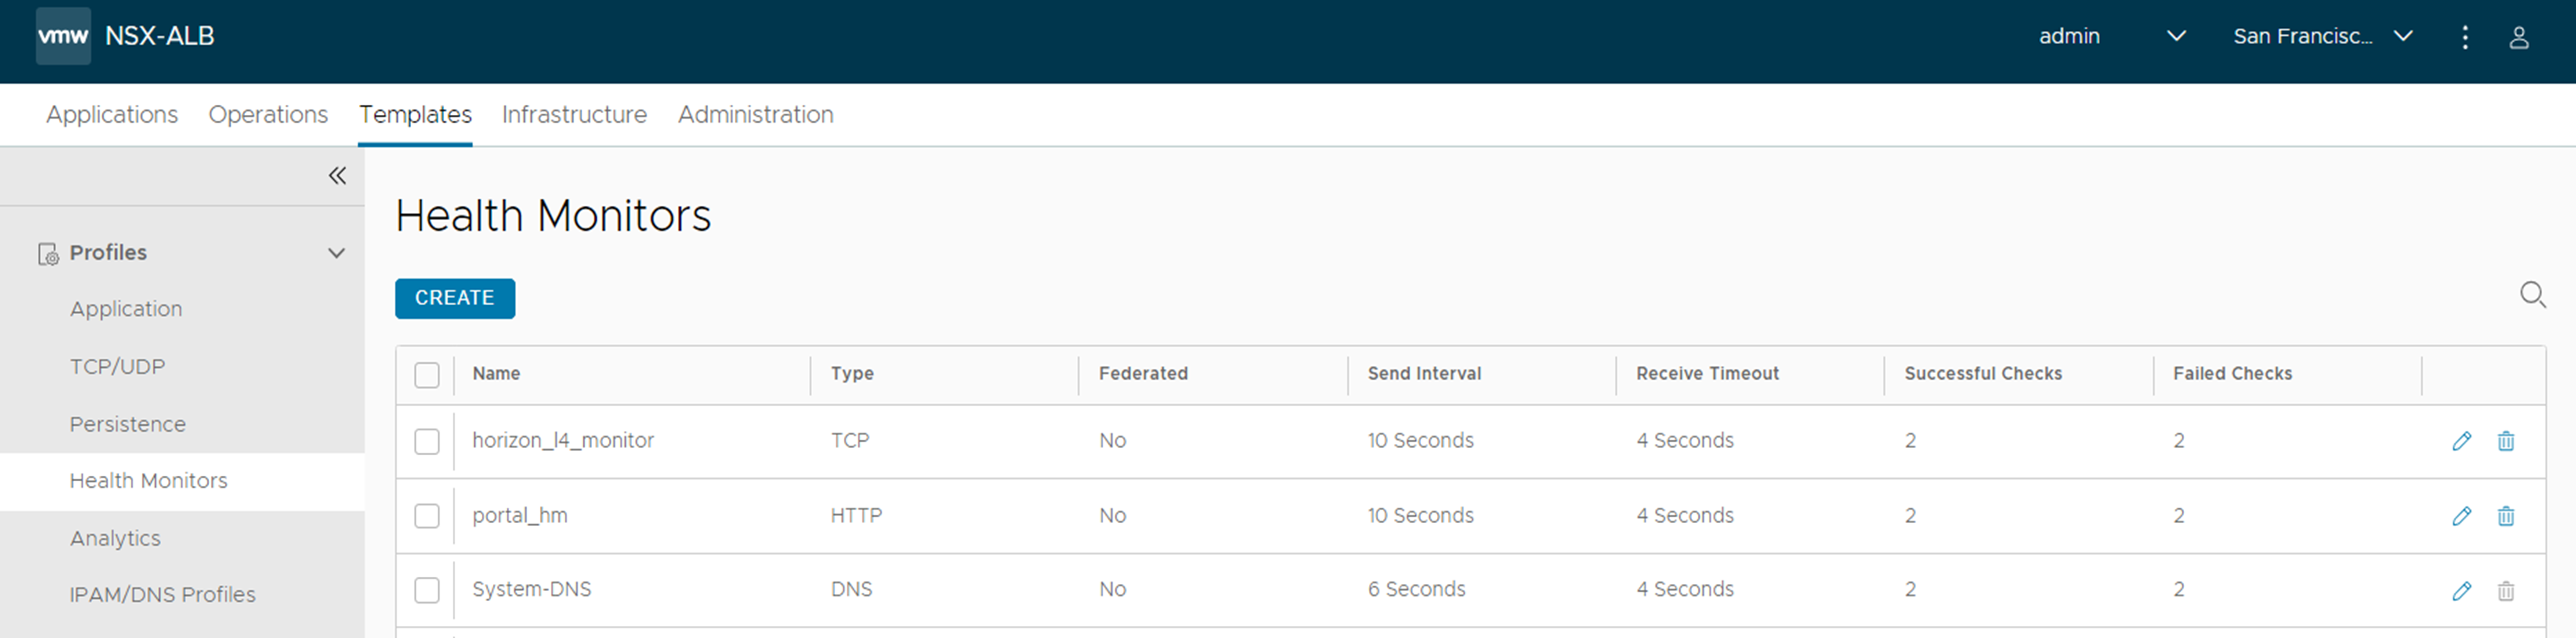
Under the Health Monitors, you can perform the following functions:
Search: Click the search icon to search across the list of objects.
Create: Click the Create icon to open the New Health Monitor window.
Edit: Click the edit icon to open the Edit Health Monitor window.
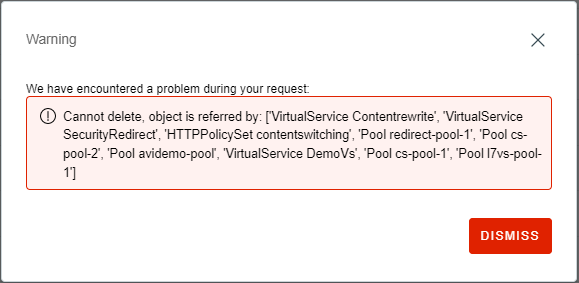
Delete: You can delete a profile if it is not currently assigned to a virtual service. If the selected health monitor is referenced to other objects, a warning message is displayed.
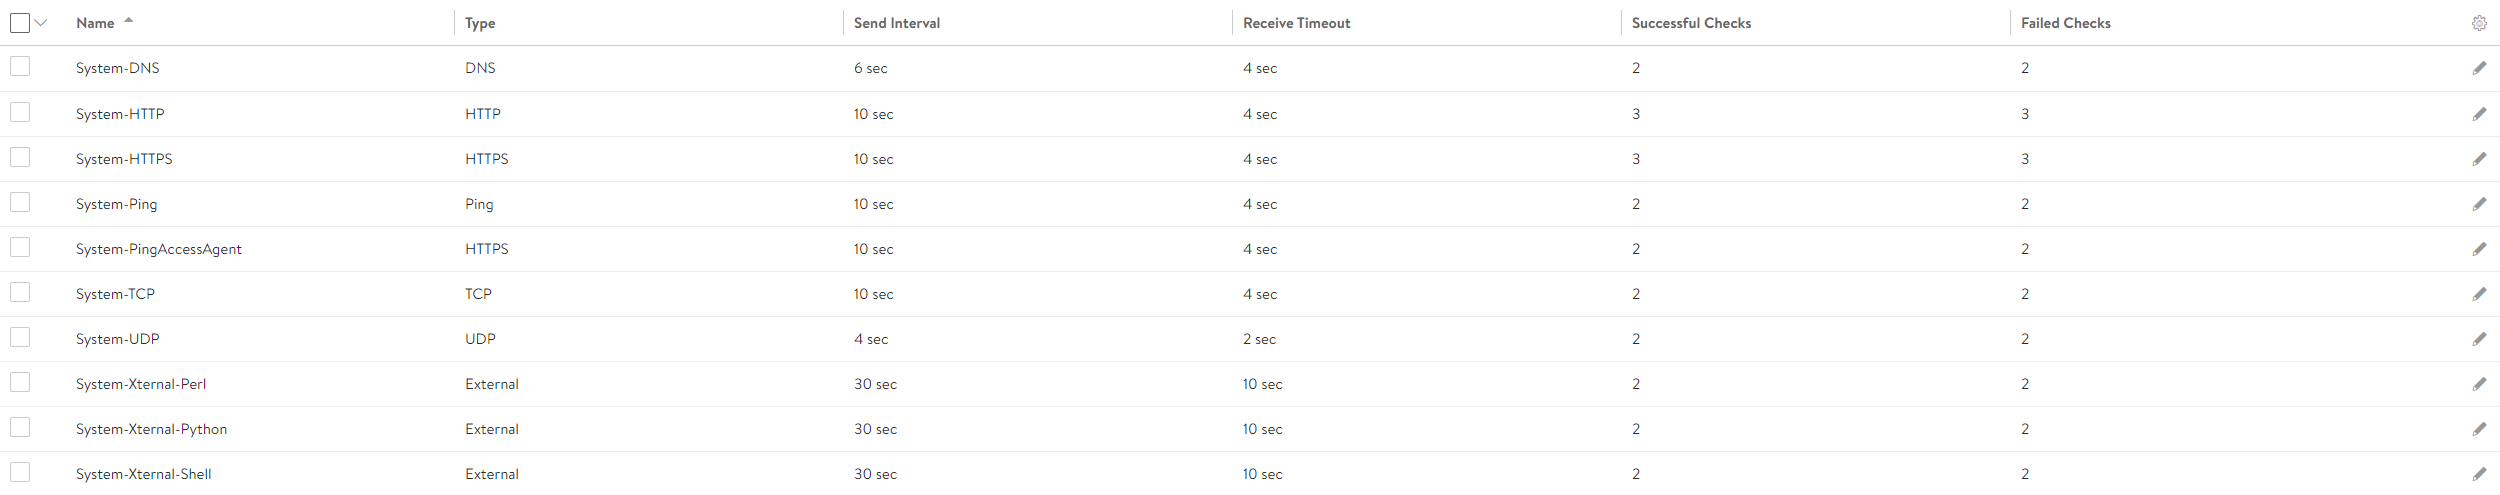
You can edit the default system health monitor templates but cannot delete them.
Creating a New Health Monitor
To create a new health monitor,
Navigate to and click Create. The New Health Monitor screen is displayed.
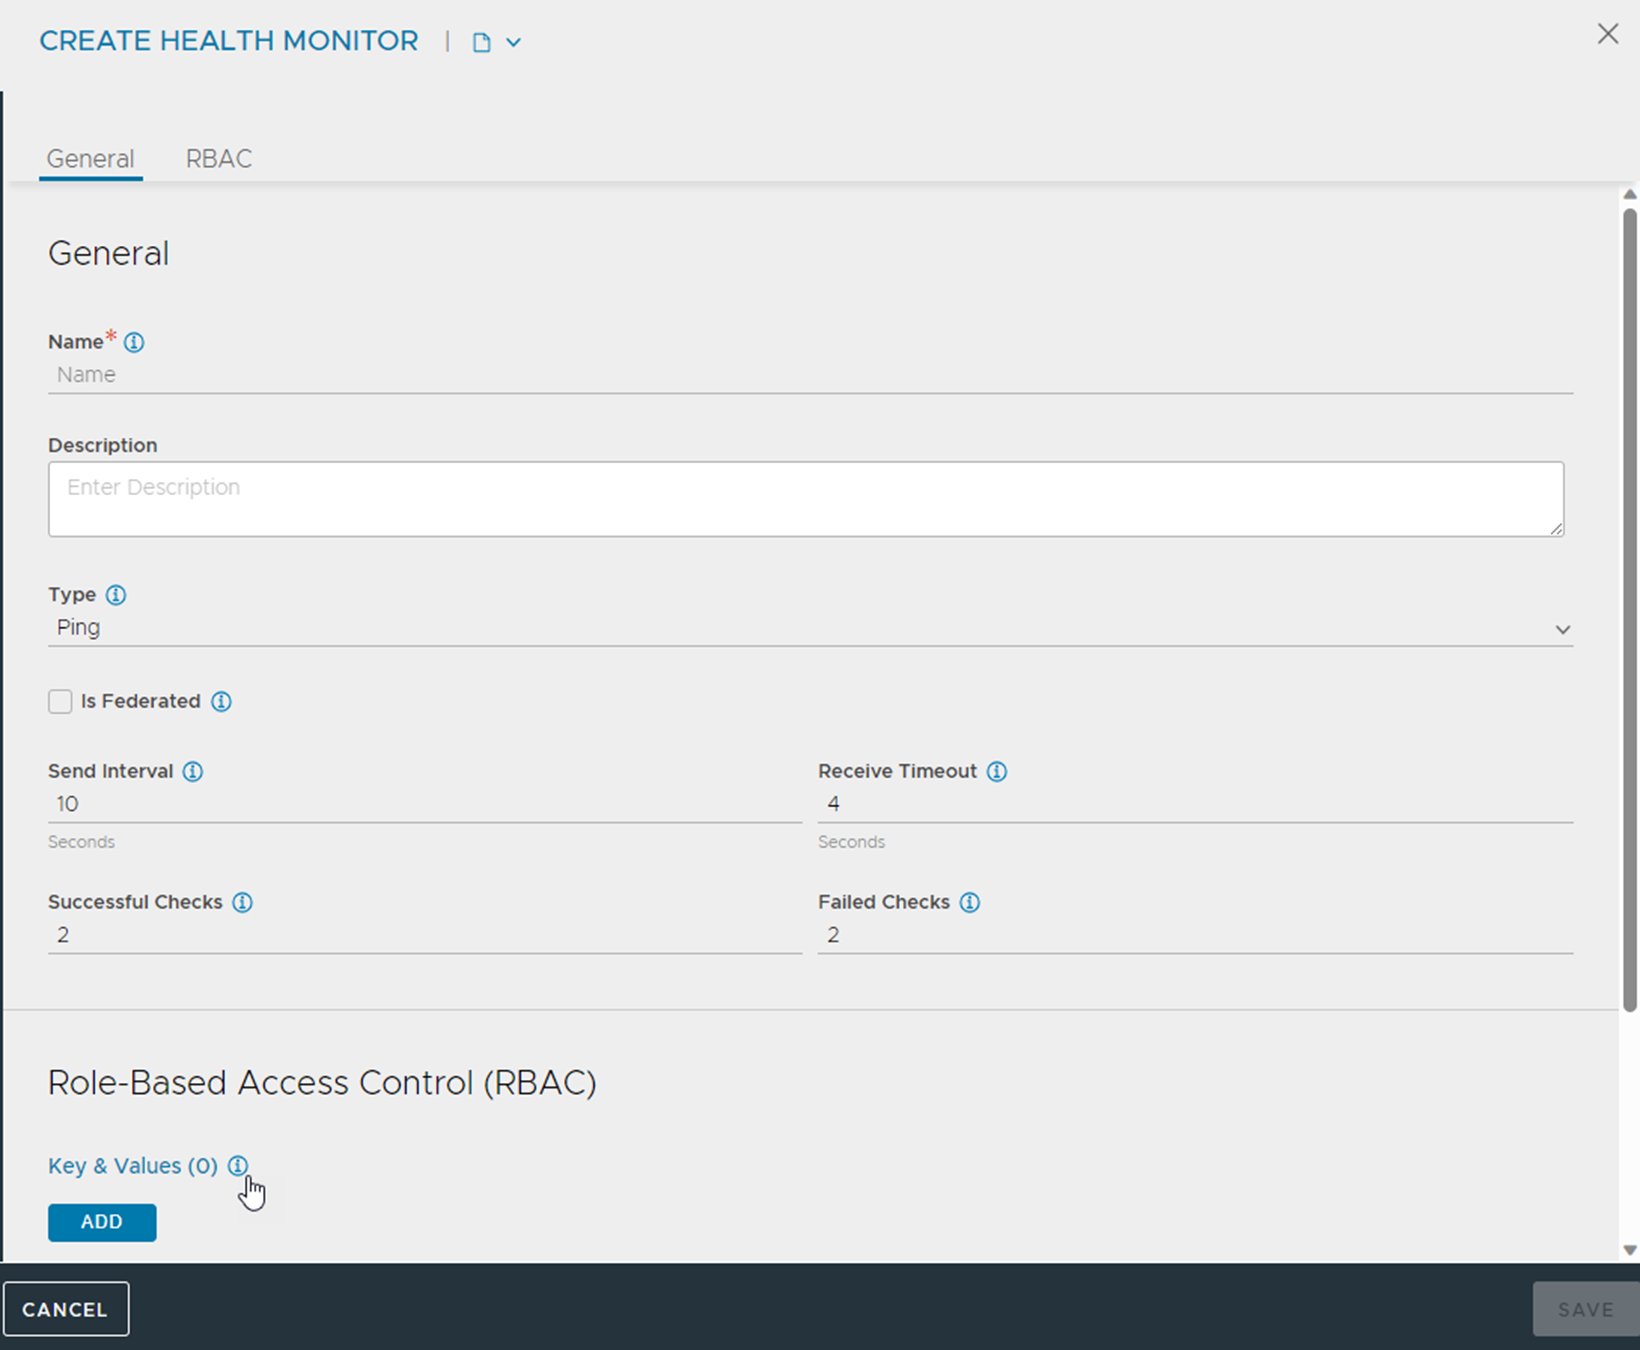
Enter the Name of the health monitor and Select the Type of health monitor.
Note:Once the Type of Monitor is selected, options specific to the health monitor type are displayed.
Select the option Is Federated? to replicate the object across the GSLB federation. When this option is not selected, the object is visible within the Controller-cluster and its associated SEs. This option is enabled only when GSLB is activated. A federated health monitor is used for GSLB purposes while it is not applicable for a regular (non-federated) health-monitor. A GSLB service cannot be associated with a regular (non-federated) health monitor, because GSLB service is a federated object, while the health monitor is not. Conversely, a pool cannot be associated with a federated health monitor because the pool is not a federated object.
Enter the Send Interval, to specify how frequently the health monitor initiates an active check of a server (in seconds). The minimum frequency is 1 second and the maximum is 3600 seconds.
Enter the Receive Timeout, the maximum time before the server must return a valid response to the health monitor (in seconds).
Enter Successful Checks, the number of consecutive health checks that must succeed before NSX Advanced Load Balancer qualifies a server with status
DOWNasUP.Enter Failed Checks, the number of consecutive health checks that must fail before NSX Advanced Load Balancer marks a server with status
UPasDOWN.Configure the settings specific to the health monitor type. For more information on the types of health monitors, see Health Monitor Types.
Under the Role-Based Access Control (RBAC) section, configure labels to control access to the health monitor based on the defined roles. See Granular Role-Based Access Controls Using Labels in the VMware NSX Advanced Load Balancer Administration Guide for more information.
Click Save to complete the health monitor creation.
The New Health Monitor and Edit Health Monitor windows share the same interface. However, once the health monitor Type selected during health monitor creation cannot be modified in the edit mode.
