


GSLB service is the representation of a global application deployed at multiple sites. The GSLB service configuration defines the FQDN of the application, the backing of virtual services across multiple sites, and the priority or ratios that govern the selection of a particular virtual service at any given time. The configuration also defines the health-monitoring methods by which unhealthy components can be identified so that the best alternatives may be selected.
GSLB Service Health Monitoring
GSLB service health monitoring is of two categories:
Control Plane
Data Plane
Default Behavior
HM Proxy
HM Sharding
Control-Plane-Based Global Application Health Monitoring
Independent of the NSX Advanced Load Balancer GSLB, every Controller cluster routinely performs local health checks to collect the health scores and performance metrics of virtual services under its direct control.
Control-plane health monitor is used to assess the health of Avi member services by collecting virtual service health status from their local Avi Controllers. This option is irrelevant to external virtual services, whose health can only be assessed via data path health checks.
The knob to turn on/off the control-plane health monitoring has been deprecated. The control-plane health monitoring will always be present irrespective of the knob.
The control-plane health monitor will always consider the 3rd party GSLB site members as UP.
The control-plane health monitor does periodic health sync-ups with the rest of the sites. This periodic sync-up is controlled by a config called send_interval. This field is configurable through the API and CLI to change the interval.
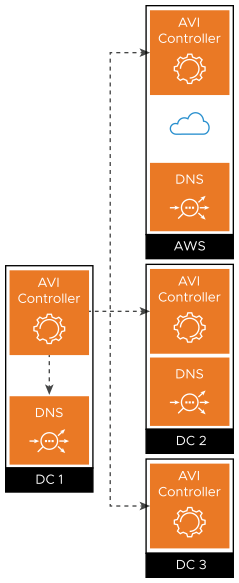
The following image shows only the active Controller in DC1 collecting health information from 3 other Controllers. DC1’s Controller passes a coalesced picture of health status to its local DNS (solid arrow). In reality, the active Controllers in DC2 and AWS update their respective local DNS virtual service with control-plane-based health status.
Data-Plane-Based Global Application Health Monitoring
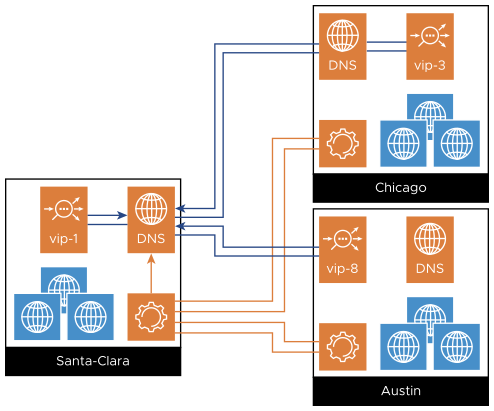
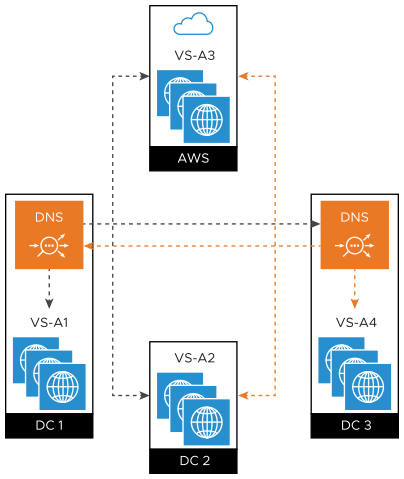
This is the default behavior of data-plane-based health monitoring. In contrast to control-plane-based health monitoring, no site’s Controller cluster is queried. Instead, health checks go directly to participating services, that is, to the data plane. At an active site, an SE hosting a GSLB DNS virtual service performs periodic health checks against all GSLB pool members (including the virtual services local to it). Active monitors generate synthetic traffic from the DNS SE to mark a GSLB pool member up or down, based on its response.
The following diagram shows the DNS in DC1 (the only active site) performing this function against its local virtual service (VS-A1),and VS-A2, VS-A3, and VS-A4. Similarly, if NSX Advanced Load Balancer DNS virtual service is running on other sites then those DNS SEs would perform the data plane health monitoring in the same way.
Ping, TCP, UDP, DNS, and HTTP(S) health monitors are supported as mentioned in the Health Monitor Types section in the VMware NSX Advanced Load Balancer Configuration Guide. Also, a custom monitor can be configured as per the requirement.
It is recommended to configure different SE groups for GSLB DNS and load balancing virtual services.
For more information on health monitors, see Health Monitoring in the VMware NSX Advanced Load Balancer Configuration Guide.
Options and Combinations for GSLB Service Health Monitoring
Control plane health checking only:
Active data-plane health monitors are not configured for this mode. All active Controllers are configured to coalesce health status collected locally with the statistics collected from remote Controllers.
Coalesced stats are then passed from each active Controller (cluster) to its local DNS. This method is only available for members implemented as NSX Advanced Load Balancer virtual services.
Both control plane and data plane health checking:
In the case of data-plane health monitoring, each GSLB DNS performs health checks on all GSLB member virtual services (including those hosted on external sites).
When data plane health checking is enabled, for a member virtual service to be marked UP, both control and data health must report UP. If the control-plane health check is failing due to the remote site being unreachable, in this case, only the data plane health monitors will determine the state of the GSLB service member.
An important point of consideration is that the default control-plane health monitor is always set by default. The control-plane health monitor does periodic health sync-ups with the rest of the sites. This periodic sync-up is controlled by a config called send_interval. Therefore, the total number of health monitors(hm) will always be number of health monitors configured + 1 (control plane default health monitor) or hm + 1.
The multiple data plane health monitors can be added if required. We can chose when a pool member should be UP - when all the health monitors are UP or when some of the health monitors are UP. This behavior can be controlled by the the configuration knob Min. Health Monitors to Consider Server 'UP.
To understand the behavior in various failure scenarios, Failure Scenarios and Resolutions.
In addition, for data-plane health monitors to work, all active sites must be able to probe all virtual services at every site participating in a GSLB service and configured to be probed (a GSLB service can be configured to probe all members or just non-NSX Advanced Load Balancer members). (In case firewall rules cannot be modified to achieve this, see Health Monitor Sharding).
For more information, see:
DNS Health Monitor in the VMware NSX Advanced Load Balancer Configuration Guide
