


The NSX CLI can be used to get detailed tail logs, take packet captures, and look at the metrics for troubleshooting the load balancer.
Problem
Load balancing is not working as expected.
Solution
- Enable or verify you can SSH to the virtual appliance. The edge services gateway is a virtual appliance that has the option to enable SSH while deploying. If you need to enable SSH, select the required appliance, and in the Actions menu, click Change CLI Credentials.

- The edge services gateway has multiple show commands to look at the run time state, and the configuration state. Use the commands to show configuration and statistics information.
nsxedge> show configuration loadbalancer
nsxedge> show configuration loadbalancer virtual [virtual-server-name]
nsxedge> show configuration loadbalancer pool [pool-name]
nsxedge> show configuration loadbalancer monitor [monitor-name]
nsxedge> show configuration loadbalancer profile [profile-name]
nsxedge> show configuration loadbalancer rule [rule-name]
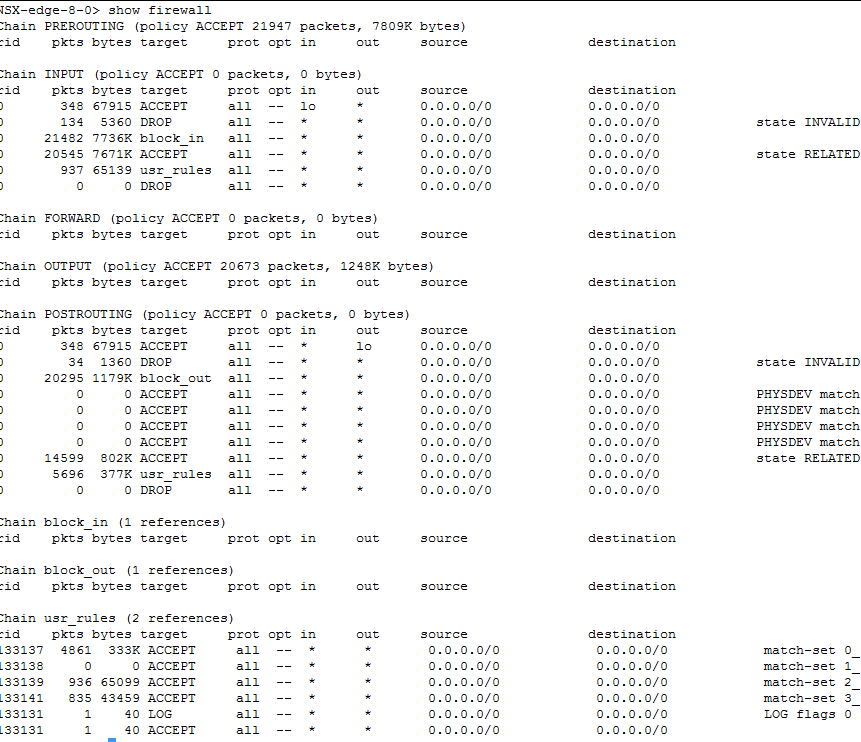
- For load balancing and NAT to function correctly the firewall should be enabled. Use the #show firewall command. If you do not see any meaningful output using the command, refer to the Load Balancer Configuration Verification and Troubleshooting Using the UI section.
- Load balancer requires NAT to function correctly. Use the show nat command. If you do not see any meaningful output using the command, refer to the Load Balancer Configuration Verification and Troubleshooting Using the UI section.

- In addition to the firewall being enabled and the load balancer having NAT rules, you should also make sure the load balancing process is enabled. Use the show service loadbalancer command to check the load balancer engine status (L4/L7).
nsxedge> show service loadbalancer haIndex: 0 ----------------------------------------------------------------------- Loadbalancer Services Status: L7 Loadbalancer : running ----------------------------------------------------------------------- L7 Loadbalancer Statistics: STATUS PID MAX_MEM_MB MAX_SOCK MAX_CONN MAX_PIPE CUR_CONN CONN_RATE CONN_RATE_LIMIT MAX_CONN_RATE running 1580 0 2081 1024 0 0 0 0 0 ----------------------------------------------------------------------- L4 Loadbalancer Statistics: MAX_CONN ACT_CONN INACT_CONN TOTAL_CONN 0 0 0 0 Prot LocalAddress:Port Scheduler Flags -> RemoteAddress:Port Forward Weight ActiveConn InActConn- Use the show service loadbalancer session command to view the load balancer session table. You will see sessions if there is traffic on the system.
nsxedge> show service loadbalancer session
-----------------------------------------------------------------------
L7 Loadbalancer Statistics:
STATUS     PID        MAX_MEM_MB MAX_SOCK   MAX_CONN   MAX_PIPE   CUR_CONN   CONN_RATE  CONN_RATE_LIMIT MAX_CONN_RATE
running    1580       0          2081       1024       0          0          0          0               0

-----------------L7 Loadbalancer Current Sessions:

0x2192df1f300: proto=unix_stream src=unix:1 fe=GLOBAL be=<NONE> srv=<none> ts=09 age=0s calls=2 rq[f=c08200h,
i=0,an=00h,rx=20s,wx=,ax=] rp[f=008000h,i=0,an=00h,rx=,wx=,ax=] s0=[7,8h,fd=1,ex=] s1=[7,0h,fd=-1,ex=] exp=19s


-----------------------------------------------------------------------
L4 Loadbalancer Statistics:
MAX_CONN   ACT_CONN   INACT_CONN TOTAL_CONN
0          0          0          0

L4 Loadbalancer Current Sessions:

pro expire state       source       virtual    destination
- Check the show service loadbalancer command to view the load balancer Layer 7 sticky-table status. Note that this table does not display information on accelerated virtual servers.
nsxedge> show service loadbalancer table
-----------------------------------------------------------------------
L7 Loadbalancer Sticky Table Status:

TABLE    TYPE    SIZE(BYTE)   USED(BYTE)
- Use the show service loadbalancer session command to view the load balancer session table. You will see sessions if there is traffic on the system.
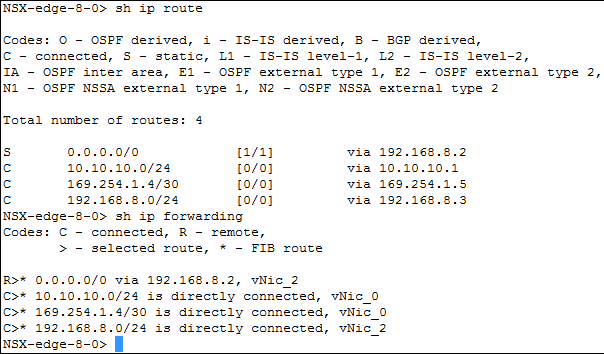
- If all the required services are running properly, look at the routing table and you need to have a route to the client and to the servers. Use the show ip route and show ip forwarding commands which maps routes to the interfaces.
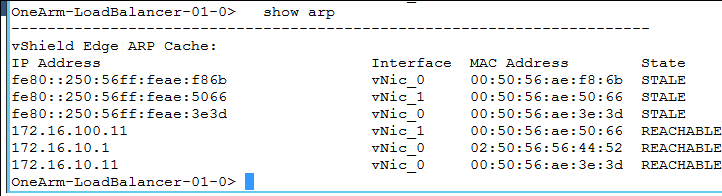
- Make sure that you have an ARP entry for the systems, such as the gateway or next hop, and the backend servers using the show arp command.
- The logs provide information to help find traffic which might help to diagnose issues. Use the show log or show log follow commands to tail the log that will help to find the traffic. Note that you must be running the load balancer with Logging enabled, and set to Info or Debug.
nsxedge> show log 2016-04-20T20:15:36+00:00 vShieldEdge kernel: Initializing cgroup subsys cpuset 2016-04-20T20:15:36+00:00 vShieldEdge kernel: Initializing cgroup subsys cpu 2016-04-20T20:15:36+00:00 vShieldEdge kernel: Initializing cgroup subsys cpuacct ... - After verifying that the basic services are running with proper paths to the clients, lets look at what is happening in the application layer. Use the show service loadbalancer pool command to view the load balancer pool status (L4/L7). One pool member must be up to serve content, and usually more than one is needed as the volume of requests exceeds the capacity of single workload. If health monitor is provided by built-in health check, the output displays last state change time and failure reason when health check fails. If health monitor is provided by monitor service, beside the above two outputs, last check time is also displayed.
nsxedge> show service loadbalancer pool ----------------------------------------------------------------------- Loadbalancer Pool Statistics: POOL Web-Tier-Pool-01 | LB METHOD round-robin | LB PROTOCOL L7 | Transparent disabled | SESSION (cur, max, total) = (0, 0, 0) | BYTES in = (0), out = (0) +->POOL MEMBER: Web-Tier-Pool-01/web-01a, STATUS: UP | | HEALTH MONITOR = BUILT-IN, default_https_monitor:L7OK | | | LAST STATE CHANGE: 2016-05-16 07:02:00 | | SESSION (cur, max, total) = (0, 0, 0) | | BYTES in = (0), out = (0) +->POOL MEMBER: Web-Tier-Pool-01/web-02a, STATUS: UP | | HEALTH MONITOR = BUILT-IN, default_https_monitor:L7OK | | | LAST STATE CHANGE: 2016-05-16 07:02:01 | | SESSION (cur, max, total) = (0, 0, 0) | | BYTES in = (0), out = (0) - Check the service monitor status (OK, WARNING, CRITICAL) to see the health of all the configured backend servers.
nsxedge> show service loadbalancer monitor
-----------------------------------------------------------------------
Loadbalancer Health Check Statistics:

MONITOR PROVIDER   POOL               MEMBER     HEALTH STATUS
built-in           Web-Tier-Pool-01   web-01a    default_https_monitor:L7OK
built-in           Web-Tier-Pool-01   web-02a    default_https_monitor:L7OK
For the show service load balancer monitor command, three types of health monitor values are displayed in the CLI output:- Built-in: Health check is enabled and is performed by L7 engine (HA proxy).
- Monitor Service: Health check is enabled and is performed by monitor service engine (NAGIOS). The monitor service running status can be checked with
show service monitorandshow service monitor serviceCLI commands. The Status field should be OK, WARNING or CRITICAL. - Not Defined: Health check is disabled.
Table 1. Health status with description Health Status Description Built-in - UNK: Unknown
- INI: Initializing
- SOCKERR: Socket error
- L4OK: Check passed on layer 4, no upper layers testing enabled
- L4TOUT: Layer 1-4 timeout
- L4CON: Layer 1-4 connection problem. For example, "Connection refused" (tcp rst) or "No route to host" (icmp)
- L6OK: Check passed on layer 6
- L6TOUT: Layer 6 (SSL) timeout
- L6RSP: Layer 6 invalid response - protocol error. May caused as the:
- Backend server only supports “SSLv3” or “TLSv1.0”, or
- Certificate of the backend server is invalid, or
- The cipher negotiation failed, and so on
- L7OK: Check passed on layer 7
- L7OKC: Check conditionally passed on layer 7. For example, 404 with disable-on-404
- L7TOUT: Layer 7 (HTTP/SMTP) timeout
- L7RSP: Layer 7 invalid response - protocol error
- L7STS: Layer 7 response error. For example, HTTP 5xx
CRITICAL - SSL protocol version 2 is not supported by your SSL library
- Unsupported SSL protocol version
- Cannot create SSL context
- Cannot make SSL connection
- Cannot initiate SSL handshake
- Cannot retrieve server certificate
- Cannot retrieve certificate subject
- Wrong time format in certificate
- Certificate '<cn>' expired on <expire time of certificate>
- Certificate '<cn>' expired today <expire time of certificate>
WARNING/CRITICAL Certificate ‘<cn>' expires in <days_left/expire time of certificate> day(s)
ICMP - Net unreachable
- Host unreachable
- Protocol unreachable
- Port unreachable
- Source route failed
- Source host isolated
- Unknown network
- Unknown host
- Network denied
- Host denied
- Bad type of service (ToS) for network
- Bad type of service (ToS) for host
- Prohibited by filter
- Host precedence violation
- Precedence cutoff. Minimum level of precedence required for the operation
- Invalid code
UDP/TCP - Socket creation failed
- Connect to address xxxx and port xxx: [Refer to Linux error code]
- No data received from host
- Unexpected response from host/socket
HTTP/HTTPS - HTTP UNKNOWN: Memory allocation error
- HTTP CRITICAL: Unable to open TCP socket (create socket or connect to server failed)
- HTTP CRITICAL: Error while receiving data
- HTTP CRITICAL: No data received from host
- HTTP CRITICAL: Invalid HTTP response received from host: <status line> (Incorrect expected status line format)
- HTTP CRITICAL: Invalid status Line <status line> (status code is not 3 digits: XXX)
- HTTP CRITICAL: Invalid status <status line> (status code >= 600 or < 100)
- HTTP CRITICAL: String not found
- HTTP CRITICAL: Pattern not found
- HTTP WARNING: Page size <page_length> too large
- HTTP WARNING: Page size <page_length> too small
- When the error code is L4TOUT/L4CON, it is usually connectivity issues on the underlying networking. Duplicate IP often happens as root cause with such reason. When this error happens, troubleshoot as follows:
- Check the High Availability (HA) status of edges, when HA is enabled by using the show service highavailability command on both the edges. Check if the HA link is DOWN and all the edges are Active, so there are no duplicate edge IP on the network.
- Check edge ARP table by show arp command, and verify if the backend server’s ARP entry is changed between the two MAC addresses.
- Check backend server ARP table or use the arp-ping command and check whether any other machine has the same IP similar to the edge IP.
- Check the load balancer object statistics (VIPs, pools, members). Look at the specific pool and verify that the members are up and running. Check if the transparent mode is enabled. If yes, the edge services gateway should be inline between the client and the server. Verify if the servers are showing session counter increments.
nsxedge> show service loadbalancer pool Web-Tier-VIP-01
TIMESTAMP            	SESSIONS   	BYTESIN    	BYTESOUT   	SESSIONRATE	HTTPREQS
2016-04-27 19:56:40  	00         	00         	00         	00         	00
2016-04-27 19:55:00  	00         	32         	100        	00         	00
nsxedge> show service loadbalancer pool Web-Tier-VIP-01 | MEMBER +—> POOL MEMBER: TENANT-1-TCP-POOL-80/SERVER-1, STATUS: UP +—> POOL MEMBER: TENANT-1-TCP-POOL-80/SERVER-2, STATUS: UP
- Now look at the virtual server and verify if there is a default pool, and see the pool is also bound to it. If you use pools via application rules, you need to look at the specific pools as shown in the #show service loadbalancer pool command. Specify the name of the virtual server.
nsxedge> show service loadbalancer virtual Web-Tier-VIP-01 ----------------------------------------------------------------------- Loadbalancer VirtualServer Statistics: VIRTUAL Web-Tier-VIP-01 | ADDRESS [172.16.10.10]:443 | SESSION (cur, max, total) = (0, 0, 0) | RATE (cur, max, limit) = (0, 0, 0) | BYTES in = (0), out = (0) +->POOL Web-Tier-Pool-01 | LB METHOD round-robin | LB PROTOCOL L7 | Transparent disabled | SESSION (cur, max, total) = (0, 0, 0) | BYTES in = (0), out = (0) +->POOL MEMBER: Web-Tier-Pool-01/web-01a, STATUS: UP | | HEALTH MONITOR = BUILT-IN, default_https_monitor:L7OK | | | LAST STATE CHANGE: 2016-05-16 07:02:00 | | SESSION (cur, max, total) = (0, 0, 0) | | BYTES in = (0), out = (0) +->POOL MEMBER: Web-Tier-Pool-01/web-02a, STATUS: UP | | HEALTH MONITOR = BUILT-IN, default_https_monitor:L7OK | | | LAST STATE CHANGE: 2016-05-16 07:02:01 | | SESSION (cur, max, total) = (0, 0, 0) | | BYTES in = (0), out = (0) - If everything looks to be configured correctly and still you have an error, you should capture traffic to understand what is going on. There are two connections: the client to the virtual server, and the edge services gateway to the backend pool (with or without the transparent configuration at the pool level). The #show ip forwarding command listed the vNic interfaces, and you can use that data.
For example, assume the client computer is on vNic_0 and the server on vNic_1. You use a client IP address of 192.168.1.2, a VIP IP of 192.168.2.2 running on port 80. Load balancer interface IP 192.168.3.1 and a backend server IP of 192.168.3.3. There are two different packet capture commands, one displays the packets, whereas the other captures the packets to file that you can download. Capture the packets to detect the load balancer abnormal failure. You can capture packets from two directions:
- Capture the packets from client.
- Capture the packets sent to backend server.
#debug packet capture interface interface-name [filter using _ for space]- creates a packet capture file that you can download
#debug packet display interface interface-name [filter using _ for space]- outputs packet data to the console
#debug show files - to see a list of packet capture
#debug copy scp user@url:path file-name/all - to download the packet capture
For example:- Capture on vNIC_0:
debug packet display interface vNic_0
- Capture on all interfaces:
debug packet display interface any
- Capture on vNIC_0 with a filter:
debug packet display interface vNic_0 host_192.168.11.3_and_host_192.168.11.41 - A packet capture of the client to virtual server traffic:
#debug packet display|capture interface vNic_0 host_192.168.1.2_and_host_192.168.2.2_and_port_80 - A packet capture between the edge services gateway and the server where the pool is in transparent mode:
#debug packet display|capture interface vNic_1 host 192.168.1.2_and_host_192.168.3.3_and_port_80 - A packet capture between the edge services gateway and the server where the pool is not in transparent mode:
#debug packet display|capture interface vNic_1 host 192.168.3.1_and_host_192.168.3.3_and_port_80
