The NSX Intelligence Recommendations feature can provide you with recommendations to help you micro-segment your applications.

Generating an NSX Intelligence recommendation involves recommendations of security policies, policy security groups, and services for the application. The recommendations are made based on the traffic pattern of communication between virtual machines (VMs) and physical servers in your NSX-T Data Center.

You can generate a recommendation by selecting the input entities of groups or 100 VMs and physical servers, or a combination of groups, VMs, and physical servers, or existing security policies. The total number of VMs and physical servers that you can select as input cannot exceed 100 of those entities. The total number of effective VMs and physical servers that you can use in an input that includes groups, VMs, or physical servers cannot exceed 250 input entities.

For example, if you select 50 VMs and 50 physical servers as part of your recommendation input entities, you can only select groups with no more than 150 compute members combined.

Important:

You can only generate a new recommendation for security groups that were created in Policy mode. The security groups must have at least one of the supported member types in order for the NSX Intelligence feature to begin a recommendation analysis for those security groups. The supported member types include virtual machines, physical servers, virtual network interfaces (VIFs), logical ports, and logical switches. If at least one supported member type is present in the security group, the recommendation analysis can proceed, but unsupported member types are not considered during the recommendation analysis.

There are multiple ways to generate a recommendation using the NSX Intelligence user interface. The following procedure describes the available methods to use.

Prerequisites

  • Activate the NSX Intelligence 3.2 or later feature on the NSX Application Platform. See the Activating and Upgrading VMware NSX Intelligence 3.2 document.

  • Ensure you have the required privileges to generate recommendations. See Role-Based Access Control in NSX Intelligence for more information.

Procedure

  1. From your browser, log in with the required privileges to an NSX Manager at https://<nsx-manager-ip-address>.
  2. Initiate the generation of a new recommendation using one of the following methods.

    Where to Start

    Next Step

    Select Plan & Troubleshoot > Recommendations.

    Click Start New Recommendation.

    For recommendations for a group, select Plan & Troubleshoot > Discover & Take Action.

    1. Verify that the Groups view is selected in the Security view selection area.

    2. Right-click the node for the group on which you want to generate a recommendation.

    3. Select Start Recommendation from the drop-down menu.

    For recommendations for VMs or physical servers, select Plan & Troubleshoot > Discover & Take Action.

    Select at least one VM or physical server, or a combination of both.

    1. In the Security view selection area, click the down arrow next to Groups and select Computes.

    2. Click Show All Types and select VMs or Physical Servers. Alternatively, from the Available Items list, select specific VMs or physical servers.

    3. Click Apply.

    4. Click the recommendation wand icon recommendation wand icon on the left-side of the Flows bar.

    5. Select Start Recommendations for the Filtered Computes.

  3. In the Start New Recommendation wizard, change the default value for the Recommendation Name text box.

    Give a name that reflects the application for which the segmentation is being done. The name is used as the prefix for the names of all the recommended groups and rules created during the recommendation analysis.

  4. Change the default value for the Description text box to make it easier to recall the information about the recommendation.
  5. Define or modify the VMs or physical servers that are to be used as the boundary for the security policy recommendation.
    1. In Selected Entities in Scope, click Select Entities. If you already selected the groups, VMs, or physical servers, click the link to the number of selected entities to modify your current selection.
    2. In the Select Entities dialog box, click Groups to select one or more groups, if you want to include them. To select the VMs or physical servers that you want to use as the boundary for the analysis, click the VMs tab or the Physical Servers tab, and make your selection.

      You can select groups and up to 100 VMs or physical servers, but no more than 250 effective compute entities to use for the recommendation boundary. Deselect the ones you do not want to include. You can also click Filter and select the attributes to use to filter the groups, VMs, or physical servers that you want selected.

    3. Click Save.
    4. (Optional) If the system found that there is an existing distributed firewall (DFW) section associated with the groups you selected in the previous step, in the Select Distributed FW Section dialog box, select whether you want to use the existing distributed firewall (DFW) section or create a new one. Click Save.

      In the Start New Recommendation wizard, the number link in the Selected Entities in Scope text box indicates the number of entities that you selected.

      If you selected to use an existing distributed DFW section during the recommendation analysis, the system indicates that under the Selected Entities in Scope text box.

  6. In the Time Range text box, optionally change the default value to use to generate the recommendation.

    The default time range value is Last 1 Month. The network traffic flows that occurred between the selected VMs or physical servers, or groups of VMs or physical servers are used during the recommendation analysis. Other values to select from are Last 1 hour, Last 12 hours, Last 24 hours, Last 1 week, Last 2 weeks, or Last 1 month.

  7. Expand the Advanced Options section and modify the assigned default values, if necessary.

    If you are not using an existing DFW section, you can modify the default assigned values. If you chose to use an existing DFW section, the values shown in this section are obtained from that existing DFW section.

    1. In the Create Rules For drop-down menu, select the type of traffic flows to consider in the recommendation analysis. The default is All Traffic.
      • Incoming and Outgoing Traffic - All traffic flow types that originate from inside the application boundary to outside the boundary, and from outside the application boundary to inside of the boundary are considered.

      • Incoming Traffic - Only traffic flows that originate outside of your application boundary are considered.

      • All Traffic - All outbound, inbound, and intra-application traffic flow types are considered.

      • Incoming and Intra-application Traffic - All traffic flow types that originate from outside of your application boundary and intra-application traffic are considered.

    2. From the Default Rule drop-down menu, select a connectivity strategy to use to create the default rule for the security policy. An appropriate action is set on the rule based on the value of the connectivity strategy. The default is None.
      • Denylist - Creates a default allow rule.

      • Allowlist - Creates a default drop rule.

      • None - No default rule is created.

    3. Change the default value for the Recommendation Output, if necessary.

      Compute-Based is the default output mode used. This mode means the DFW policy recommendation that the recommendation engine generated contains groups whose members are VMs, physical servers, or both. If the IP-Based recommendation output mode is selected, the generated DFW policy recommendation contains groups whose members are IPSet objects with a static list of IP addresses. An IP-based recommendation is not tightly bound to a VM. If a VM is deleted and its IP address is assigned to a new VM, the new VM gets assigned to the same group. The DFW policies for the group are applied to the new VM also.

    4. If necessary, change the value for Recommendation Service Type.

      The default type is L4 Services, which is composed of the respective Layer 4 port and protocol. Alternatively, you can select L7 Context Profiles for Layer 7 context profiles.

    5. Change the default value for the Group Reuse Threshold as you see fit to use when generating the rule recommendation.

      You can set the threshold percentage value from 10 through 100. The value specifies how strictly the system reuses groups to cover the detected flows that are not micro-segmented. Use this value to control whether existing groups should be reused or new groups created. The group reuse feature is applicable for any recommendation job with existing security policy or new security policy.

      Setting this value to 100 means that only groups with exactly and only the same members as the compute entities the system is seeking to group can be picked as additional rule sources or destinations. Using a very high value can result in creating more new groups, however, as existing groups are less likely to be reused in rules being modified.

      Setting this value to lower values, like 10 or 20, means that even groups with extraneous members, other than the compute entities the system is seeking to group, can be picked as additional rule sources or destinations. Using a lower value can result in an aggressive group reuse and hence fewer new groups will be recommended.

    6. If necessary, change the default values selected in the Exclude Flows text box to specify the traffic flow types that you want excluded during the recommendation analysis.

      This feature is available beginning with NSX Intelligence 3.2.1. The default values are Broadcast flows and Multicast flows. These flow types are not relevant for application category rules. Excluding broadcast flows, multicast flows, or both flow types can help optimize the DFW rule recommendation analysis.

  8. To begin the recommendation analysis, click Start Discovery.

    Recommendations are processed serially. On average, it can take anywhere from 3 to 4 minutes to finish each recommendation, depending on whether there are other recommendations that are waiting to be processed. If there is a large number of traffic flows between VMs and physical servers that must be analyzed, the generation of a recommendation can take anywhere between 10–15 minutes.

    The Recommendations table displays the recommendations that you initiated, as shown in the following image.


    Screenshot of the Recommendations pane with one of the newly generated recommendations expanded to show the details.
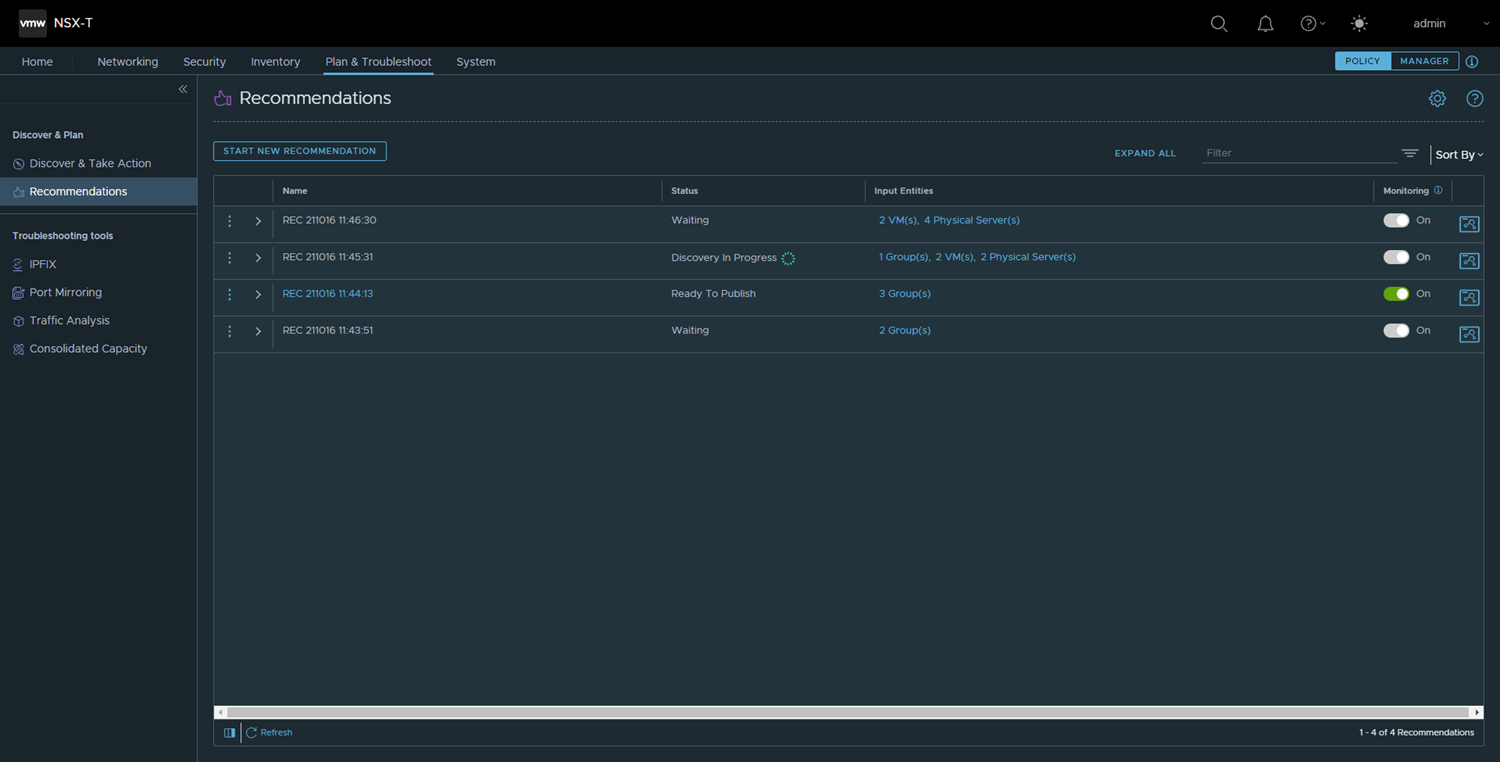
    • You can track the statuses of the recommendation analysis in the Status column of the Recommendations table. The status progresses from Waiting, to Discovery In Progress, to Ready to Publish, and Published. If the system does not generate a recommendation, the Status value is set to No Recommendations Available. If the recommendation analysis failed for some reason, the Failed status is displayed.

    • The Input Entities column lists the entities that were used to generate the recommendation. Clicking the linked text in this column displays the Selected Entities dialog box in read-only mode.

    • The Monitoring column indicates whether changes are being monitored for the original input entities used to generate the recommendation. This feature is available for recommendations with a status of Ready to Publish, No Recommendations Available, or Failed. You can toggle the Monitoring button On or Off. When the toggle is on, changes in the scope of the input entities or connectivity strategy are checked every hour.

    • If any changes occurred with any of the input entities used, the change detected icon icon when change is detected in the input entities used for the recommendation appears next to the Ready to Publish, No Recommendations Available, or Failed status. You can review the changes and rerun the recommendation. See Rerun NSX Intelligence Recommendations for more information.

    • When you click the canvas icon visualization canvas icon on the rightmost side of the recommendation row, the visualization of the selected entities is displayed in the graphical canvas under the Plan & Troubleshoot > Discover and Take Action user interface. If the recommendation status displayed is Published, when you click the canvas icon, recommended groups are displayed in the Discover and Take Action graphical canvas.

  9. When the Status value is Ready to Publish, review the generated recommendation and decide whether to publish it. See Review and Publish Generated NSX Intelligence Recommendations.