


When you click Plan & Troubleshoot in your NSX Manager UI, the system displays the Groups view on the NSX Intelligence visualization canvas. A Groups view displays all the groups and the traffic flows that occurred within the last few minutes between the compute entities belonging to those groups in your NSX environment .
Groups View Selection
If you are not seeing the Groups view, click the down arrow next to the Computes label in the Security view selection area and select Groups. In the drop-down menu displayed, you can select All Groups or specific groups from the list, and then click Apply.
Use the Search text box to filter the list of available groups. If you click away from the selection drop-down menu without making any selection or if you select All Groups in the drop-down menu, the All Groups menu item is applied to the Groups view.
Clustering of Group Nodes
Beginning with NSX Intelligence 4.0.1, when you access , the group nodes are displayed into clusters of groups by default. The Clustering By Flows mode is the default mode used. This mode is based on the traffic flows that occurred between compute entities in the groups in your NSX environment during the selected time period. With the clustering feature, you can have a high-level view of the activities in your NSX environment during the selected time period and can help you decide where to focus your attention.
If you have just activated NSX Intelligence, you might see a single collection of groups labeled as Unclustered (n), where n is the total number of groups in your NSX inventory. Even if traffic flows between the groups are already visualized in the NSX Intelligence graph, it might take the NSX Intelligence clustering job some time to complete the flows analysis and cluster the groups based on the traffic flows that have occurred during the selected time period.
The colors of the nodes correspond to the types of traffic flows that occurred with the groups during the selected time period. If there are groups that did not have any members communicating with members of any other groups during the selected time period, those groups are placed together in a separate group cluster.
The number displayed on top of the node boundary for the group cluster indicates how many groups are included in that particular cluster for the selected time period. To view more details about a specific cluster and the groups that are part of that cluster, zoom in the graph. As you zoom in closer to the nodes and arrows, the details about the groups and traffic flows become more visible and easier to select. To narrow which groups are displayed in the visualization graph, use the Apply Filter section to apply filters.
To change the clustering mode used for the visualization, click the clustering control icon  located at the bottom right of the visualization graph. You can select one of the other available mode, such as Names or Tags. The system updates the visualization graph immediately based on your clustering mode selection.
Nodes in the Groups View
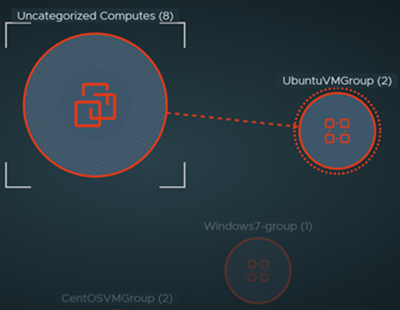
A node in a Groups view represents a group of NSX compute entities (such as VMs, physical servers, and IP addresses) or a group of uncategorized compute entities in your NSX inventory. The Groups view also includes nodes that represent entities that communicated with members of the groups, but are not part of your NSX inventory.
Type of Group Node |
Icon |
Description |
|---|---|---|
Regular Group |
|
A Regular Group node in the NSX Intelligence visualization graph represents any collection of compute entities managed in your NSX environment. The NSX Intelligence graph supports regular groups with compute entities that include VMs, physical servers, IP addresses, or a combination of those entities. An NSX entity can belong to more than one group and can appear in more than one regular group node. |
Uncategorized Group |
|
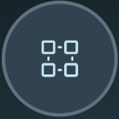
An Uncategorized Group node represents a collection of compute entities that do not belong to any group, but are in your NSX inventory. |
Unknown Group |

|
An Unknown Group node represents a set of miscellaneous compute entities that are not in the NSX inventory, but are within your data center, and are communicating to one or more NSX entities in your NSX data center. |
Public IPs Group |

|
A Public IPs Group node represents a collection of public IP addresses (IPv4 or IPv6) that are communicating to NSX objects in your NSX data center. NSX Intelligence classifies any IP address that does not belong to any of the CIDR notations listed in the Private IP Range Settings for NSX Intelligence as a public IP address. |
Size and Color of a Node
The size of a node in the Groups view is based on the number of members belonging to that group. The bigger the size of a group node, the more compute entities belong to that group. The group name and its total number of members are displayed above the node.
Type of Group Node |
Description |
|---|---|
|
A group node with a red-hued border indicates that the system detected at least one unprotected traffic flow, regardless of the number of blocked or allowed flows that the system detected during the selected time period. |

|
A blue-hued border on a node means that the system did not detect any unprotected traffic flows, but detected at least one blocked flow, regardless of how many allowed flows got detected during the selected time period. |

|
A node with a green-hued border indicates that the system did not detect any unprotected or blocked flows during the selected time period, and the system detected at least one allowed flow. |
|
|
A node with a gray-hued border means that during the selected time period there were no traffic flows detected for the compute entities belonging to that group. |
Arrows in a Groups View
The arrows between the group nodes represent the traffic flows that have occurred during the selected time period between the compute entities in those connected group nodes. A self-referencing arrow on a group node indicates that at least one compute entity was communicating with another compute entity within that same group. See Working with Traffic Flows in NSX Intelligence for more information.
Node Selection in Groups View
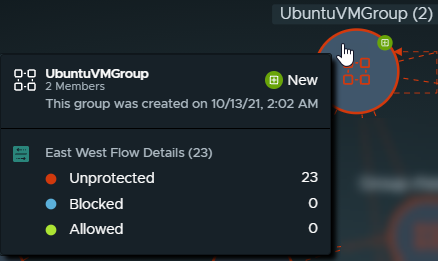
If the group got added during the selected time period, a green New badge icon
To clear the pinned selection, click any empty area of the visualization canvas.
If you zoom out of the Groups view and the details on the nodes are no longer visible, point to any visible part of a node to display the group details.
Selecting Multiple Group Nodes
To select one or more of the group nodes, click the selection control icon  located at the bottom right of the visualization graph. You can click and drag your pointer over the group nodes that you want to select. You can also press Shift and click specific group nodes to make your selection.
A new Selected panel appears to the right of the Flows section and displays the number of selected group nodes. It looks similar to this sample image  . From this Selected panel, you can click the recommendation icon
  to start a new recommendation analysis using the selected group nodes.
Available Actions in the Groups View
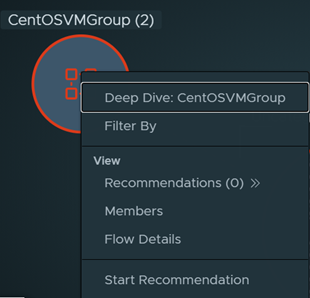
The following table describes the available actions you can select from the drop-down menu.
Selection |
Description |
|---|---|
Deep Dive:Group_Name |
Surrounds the selected group node with a dashed circle to mark it as the pinned group node or the current group in focus. The compute entities that belong to the group are shown inside the group node. All the groups that had traffic flows with the members of the pinned group during the selected time period are also placed in the Groups view. In the following example, the Windows7-group node is the pinned group. The other groups are in the view because their members had network traffic flows exchanged with the single VM in Windows7-group during the selected time period. 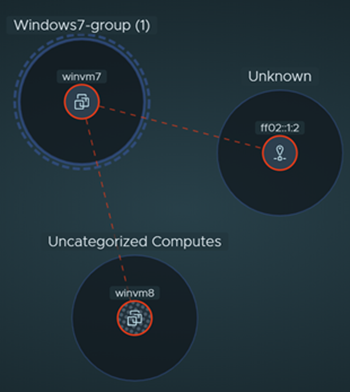 |
Filter By |
Adds the current group to the visualization filter that is used for the current Groups view. |
View Recommendations (<n>) |
Displays the table of available recommendations for the current group. From that Recommendations table, you can view the recommendation details and perform the available actions. See Working with NSX Intelligence Recommendations for more information. |
View Members |
Displays a table of all the compute entity members that belonged to the currently pinned group during the selected time period. From that Members table, you can see the details about the VMs, IP addresses, and physical servers that belong to the selected group and the other groups to which each compute entity also belongs. To add a specific VM, IP address, or physical server to the current visualization filter, click the filter icon |
View Flow Details |
The Flow Details of a Group dialog box displays a table for the currently selected group. The table shows details about the flows that have completed and the flows that were active during the selected time period. See Working with Traffic Flows in NSX Intelligence for more information. |
Start Recommendation |
Displays the Start New Recommendation wizard that assists you with generating a new DFW micro-segmentation rule recommendation. See Generate a New NSX Intelligence Recommendation for details. |
 on the right.