


The NSX Intelligence user interface provides several graphic elements to help with the visualization of the NSX entities, traffic flows, and certain activities in your NSX environment.
The following table lists a glossary of NSX graphic elements that you might see in an NSX Intelligence visualization graph.
Graphic Element |
Description |
|---|---|
|
This icon represents a group to which security policies, including East-West firewall rules, can be applied. A group can be a collection of VMs, physical servers, or sets of IP addresses. See Working with the Groups View in NSX Intelligence. |

|
This is the icon used for a virtual machine (VM) that is part of your NSX environment. A VM can belong to more than one group. See Working with the Computes View in NSX Intelligence. |

|
This icon represents a physical server that is part of your NSX environment. A physical server can belong to more than one group. See Working with the Computes View in NSX Intelligence. |

|
This is the icon for the public IP addresses on the Internet. If at least one compute entity in your NSX environment communicated with a public IP address during the selected time period, that traffic flow is included in the current visualization. |

|
This icon represents an IP address, such as a unicast, broadcast, or multicast IP address, that participated in the network traffic activities within your NSX environment during the selected time period. |


|
These icons represent a VM and a physical server, respectively, that have been classified by the system or by an administrator to provide core infrastructure services, such as DNS, DHCP, LDAP, or Active Directory, in your NSX environment. If an orange-hued badge appears on the upper-right edge of the infrastructure entity icon, as shown in this image |
|
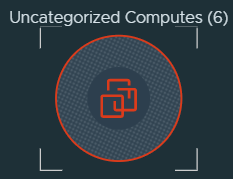
This node icon is used for the group of compute entities (VMs, physical servers, or IP address sets) that currently do not belong to a group. |

|
This arrow represents a network traffic flow that occurred between two groups or compute entities during a selected time period. There are three different types of arrows.
See Working with Traffic Flows in NSX Intelligence for more information. |
|
A node that has been selected as the current node in focus is surrounded by a dashed circle. It is the pinned node during the selection mode and the current view being displayed. |

|
This icon appears on a group node's border if the group was added to the NSX inventory during the selected time period. If NSX Intelligence discovered a new compute entity, such as a VM or physical server, during the selected time period, the icon appears on that compute entity node's border. |

|
This icon appears on the group node's border if the group was removed from the inventory during the selected time period. The group's compute entity members might or might not have been deleted. On a compute entity node's border, this icon indicates that the compute entity was removed from the NSX inventory during the selected time period. Although a compute entity or group has been removed from the NSX inventory, it still appears in the current visualization graph to give a historical view that the compute entity was removed during the selected time period. |

|
This icon appears whenever we see a group and compute entities together. For example, in a deep dive groups view or related compute entities of a group. The icon appears on a compute entity node's border after the compute entity was moved out of the current group that is being viewed. It appears on a compute entity's node border in the following cases.
|

|
This icon appears on the node border of a compute entity if the NSX Suspicious Traffic feature detected that the compute entity was part of a suspicious network traffic activity during the specified time period. See Detecting Suspicious Traffic Events in NSX for details. |

|
This hidden flows icon appears on the node border of a group or compute entity when you selected to hide one or more types of flows from being displayed. The icon is also added to the Flows panel to inform the viewer that there are flows hidden from the visualization. To hide flows from the visualization graph, right-click the group or compute entity's node, select Hide Flows from the contextual menu, select from the secondary menu the types of flows you want to hide, and click Apply. The canvas is refreshed using the latest viewing criteria. To display all the hidden flows for a group, click the hidden flows icon from the Flows panel and click Display All Flows in the displayed dialog box. Alternatively, right-click the group node, select Hide Flows, modify your selection, and click Apply. |
 , it indicates that the system-inferred infrastructure classification needs your review. For more information, see