To monitor the configuration flow between all Global Managers (GM) and Local Managers (LM) across a single NSX Federation federated domain for on-premises solutions you can use the Local Manager page. After you configure Locations, alarms display any communication issues between Global and Local Manager on the Location Manager page.
You must already have a Location added. See "Add a Location" in the NSX-T Data Center Installation Guide.
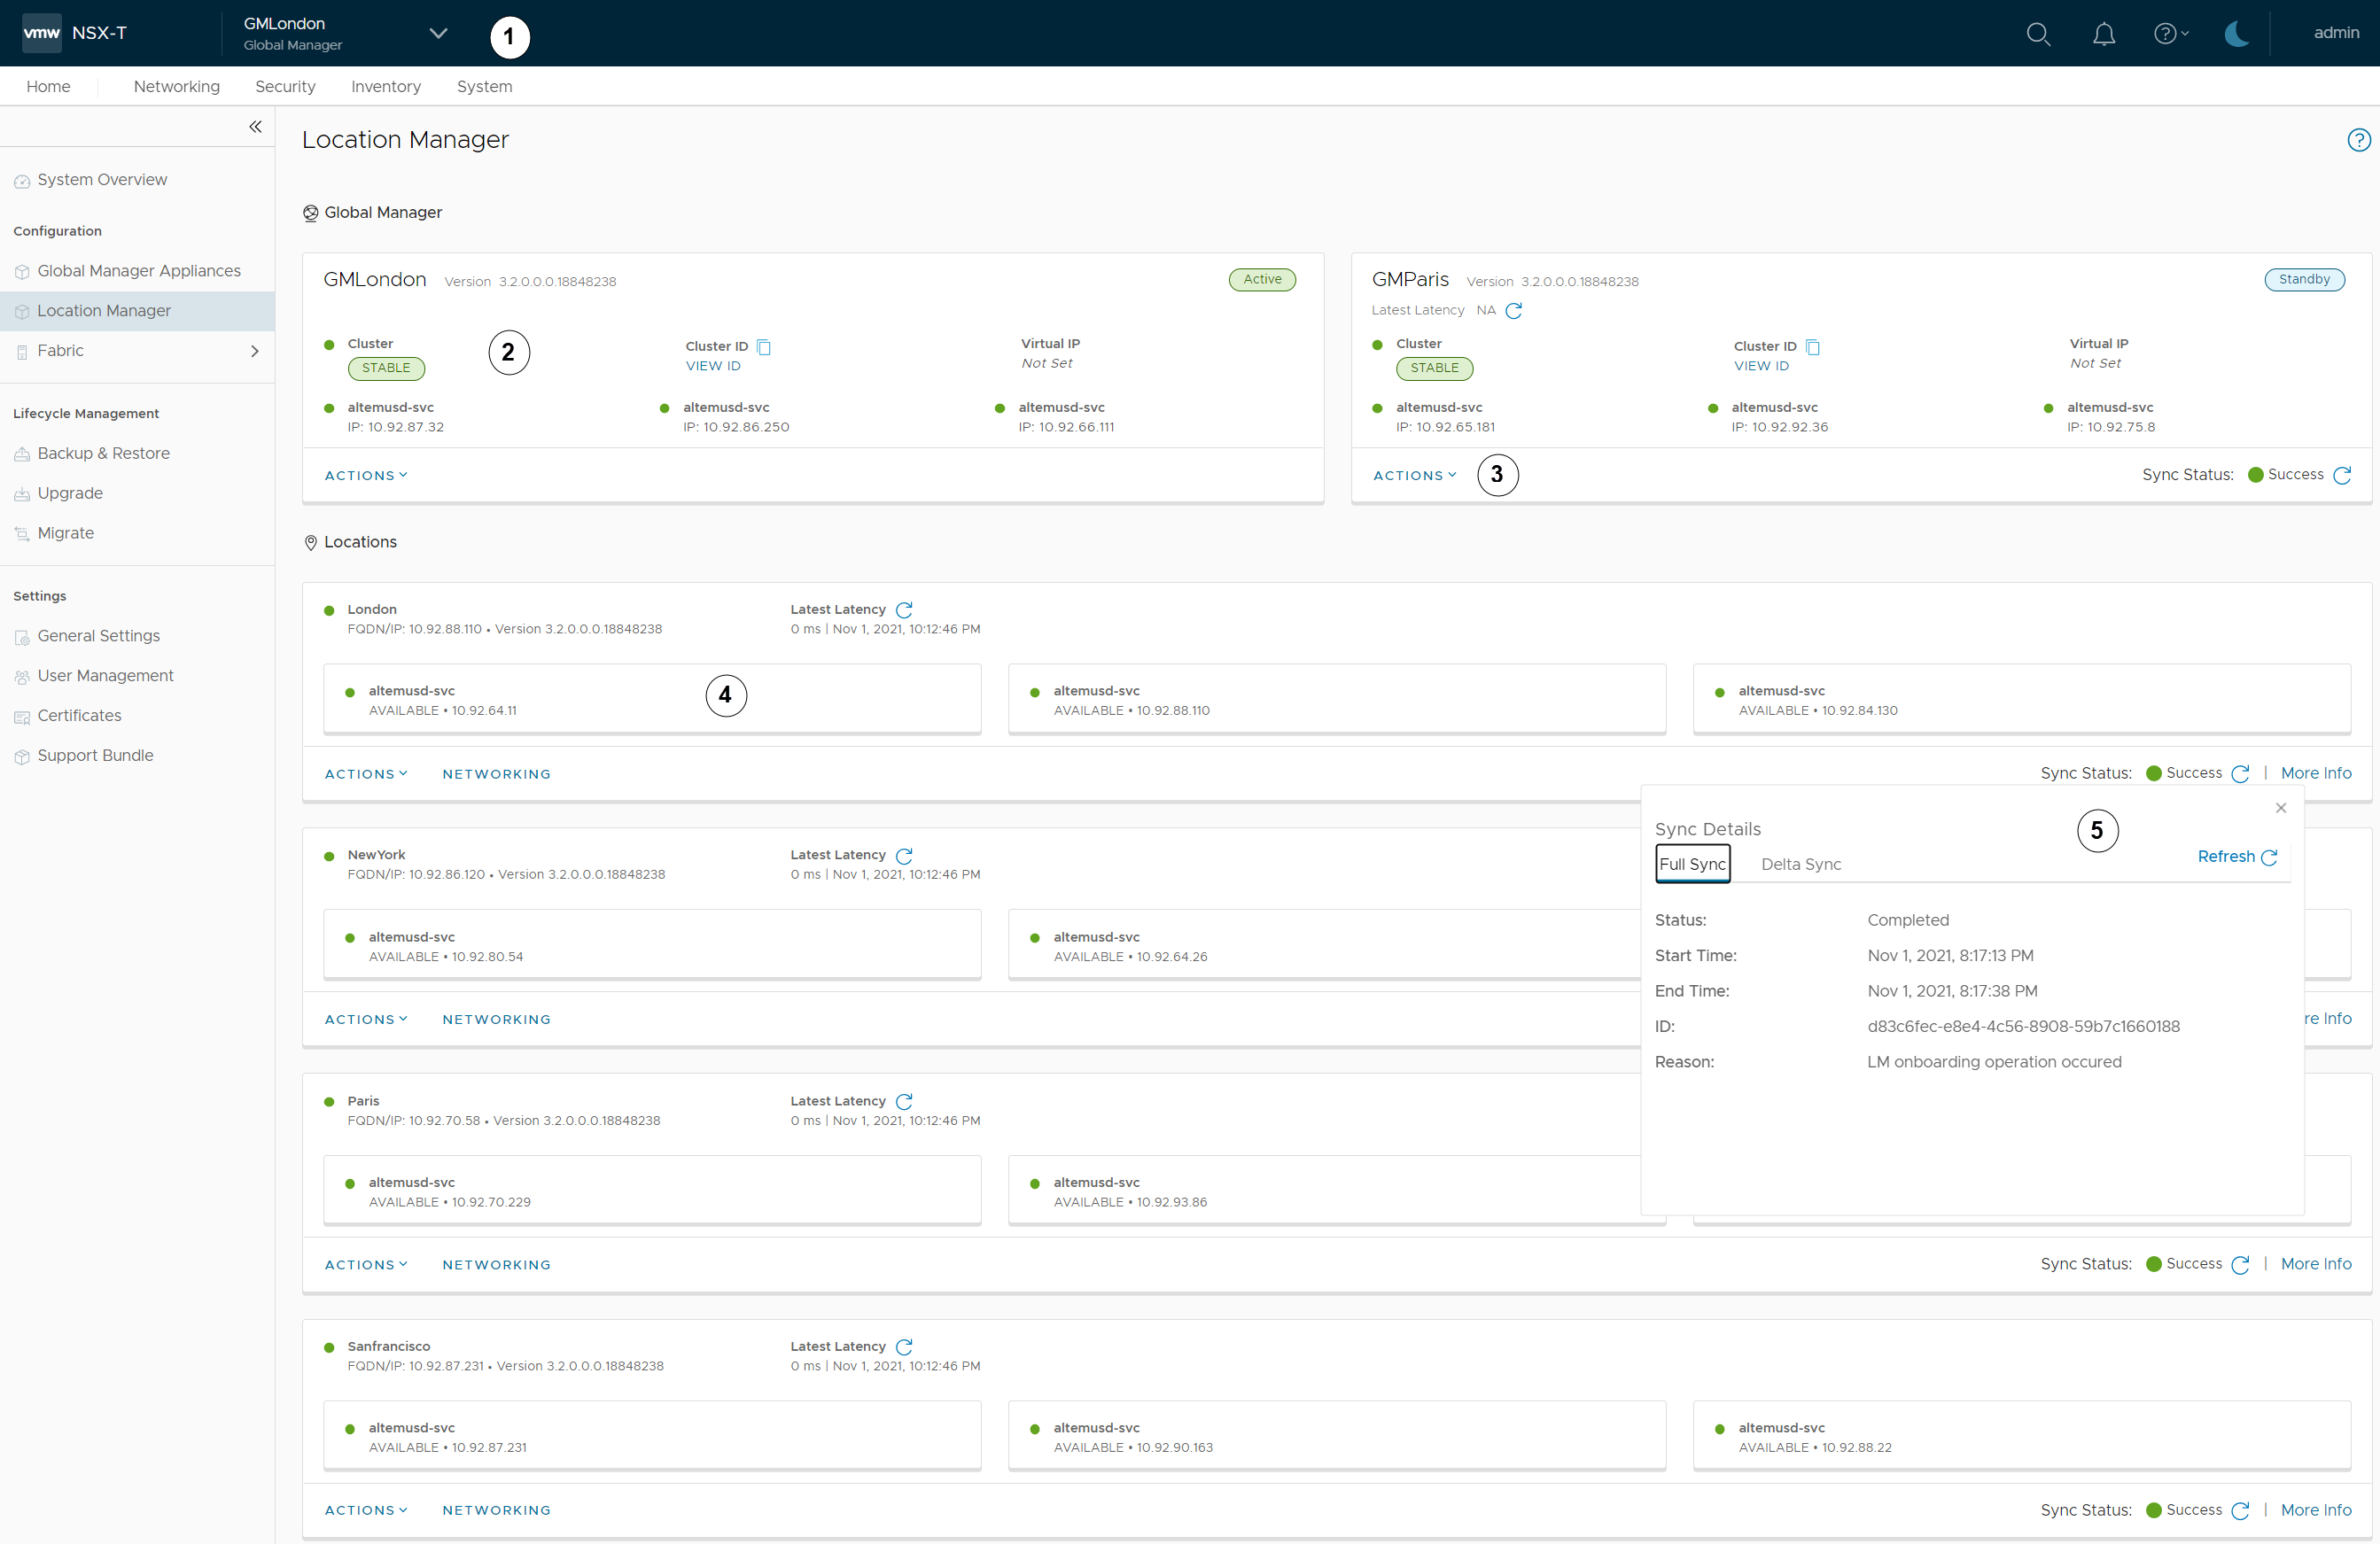
Use the Location Manager to view latency data, monitor communication synchronizations, check policies, and get better visibility into the health between the different components of the federated domain. The Global Manager View of Location Manager figure shows the Global and Local Manager details. For callout details, see the Callouts for Global Manager View of Location Manager table.
Figure 1. Global Manager View of Location Manager
Table 1. Callouts for Global Manager View of Location Manager
ID
Options
Description
1
Set location view.
Switch to different GM-active and LM views by selecting dropdown. After logging into the active GM, this drop-down indicates what instance you are logged into and lets you switch to other LM locations views. You can also switch to the standby GM, not using this dropdown, but by selecting the Actions menu in the Standby pane and clicking Access Standby GM.
2
Active GM information.
GM-Active details.
Tasks such as GM Active Name.
3
GM Standby information.
GM Standby details such as Sync Status.
Other details such as GM Standby Name, Access Standby GM View, and Remove GM Standby.
4
LM pane information.
LM details such as Latency Data, Sync Status, and Networking RTEP configuration.
Tasks such as edit settings, remove, evacuate location, and import to GM. Evacuate location allows network recovery for sites that have not lost communication. For example, if you want to migrate a data center or perform a disaster recovery test. Import to GM allows the former LM configuration to be pushed up to GM (see "Importing Configurations from Local Manager" in the NSX-T Data Center Installation Guide.
5
LM More Info pane.
View detailed Full Sync from GM Active to LM information such as Start Time, End Time, and Reason.
View detailed Delta Sync from GM Active to LM information such as Message Queues on GM and LM.
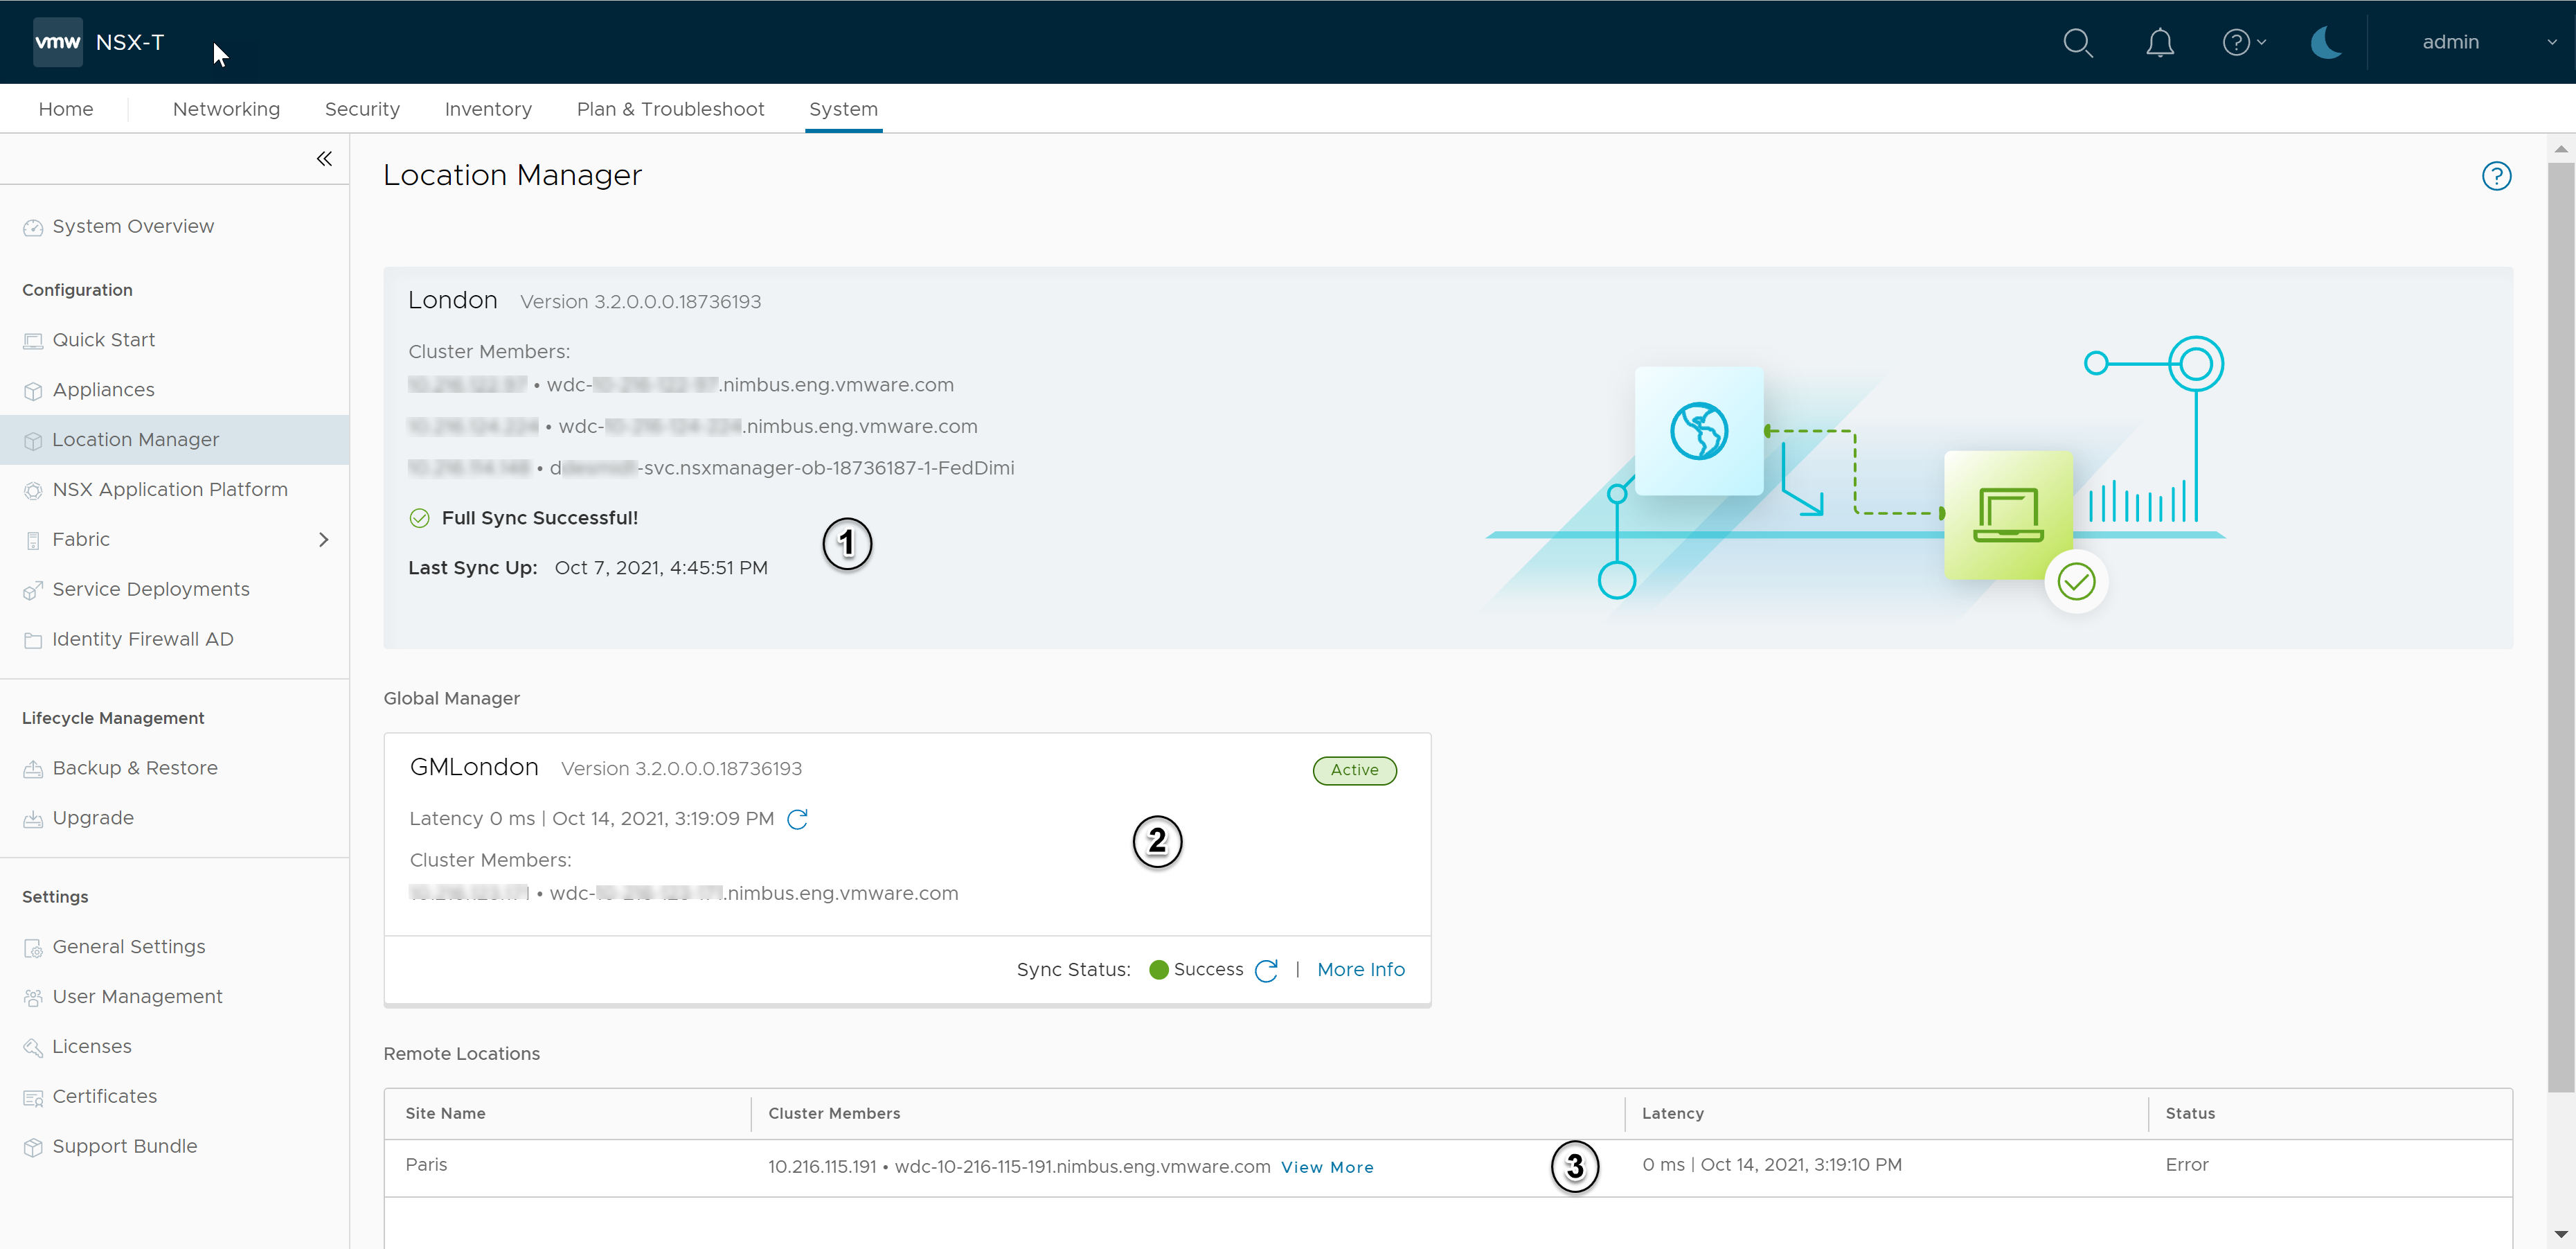
The
Local Manager View of Location Manager figure shows an example of the window details. For callout details, see the Callouts for
Local Manager View table.
Figure 2. Local Manager View of Location Manager
Table 2. Callouts for Local Manager View of Location Manager
ID
Task
Description
1
View LM details.
NSX version, cluster IPs and names, status of full sync and when it completed.
2
View related active GM details.
Software versions, latency details between GM and LM, cluster details, and color-coded sync status.
Green is communication is OK. Orange is some backlog in the queue based on threshold. Red is sync is not occurring.
To see the full sync details including status, start and end times, ID, and status reasons, click More Info.
3
View remote location details.
Cluster details, including View More information, latency data between LM and GM, and current status.
The Supported Communication Channel Details table provides details about the Location Manager displays.
Table 3. Supported Communication Channel Details
Supported Communication Channels
Display Details
All channels
Status (color-coded)
Green - OK.
Orange - Sync between active GM and Standby GM is in progress.