You can monitor the WAN links connected to a specific Edge along with the status, interface details, and other metrics.
At any point of time, you can view which Link or Transport Group is used for the traffic and how much data is sent in the tab.
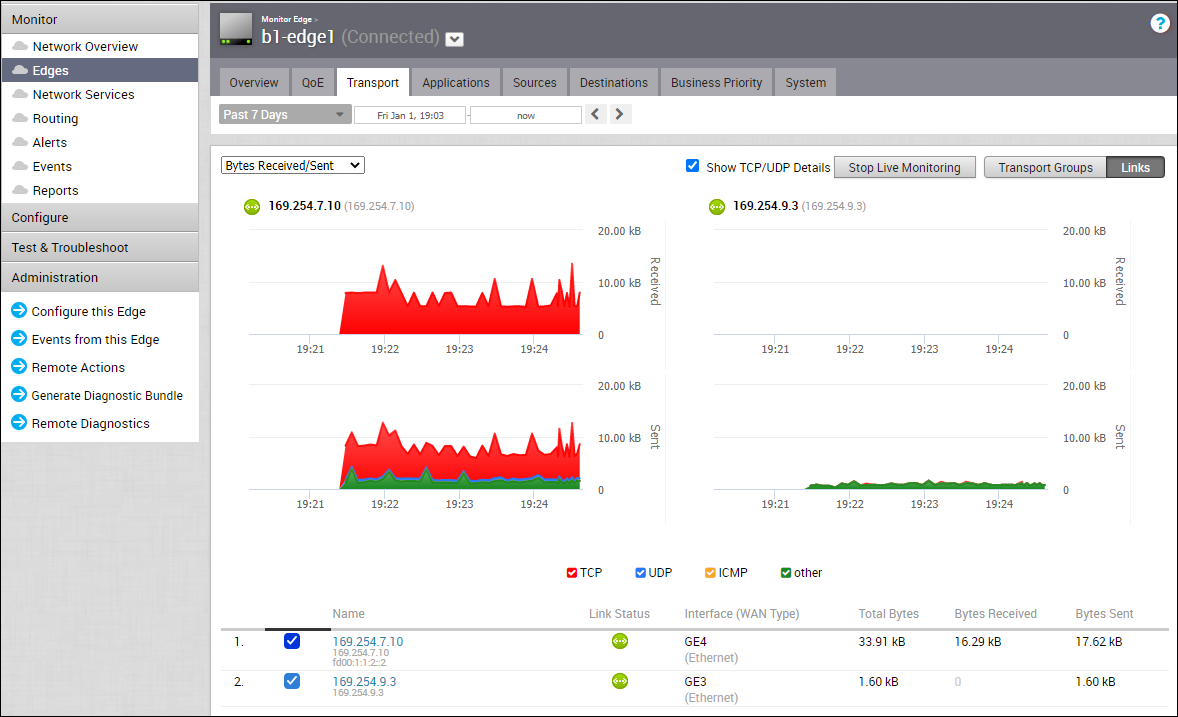
When you click the Transport tab, Links is screen is displayed by default. The screen displays Sent and Received data for your links. The links associated with an Edge are displayed in at the bottom of the screen under the Link column, along with the status for Cloud and VPN, WAN Interface, Application details, and details of Bytes.
Hover the mouse on the graphs to view more details.
At the top of the page, you can choose a specific time period to view the details of links used for the selected duration.
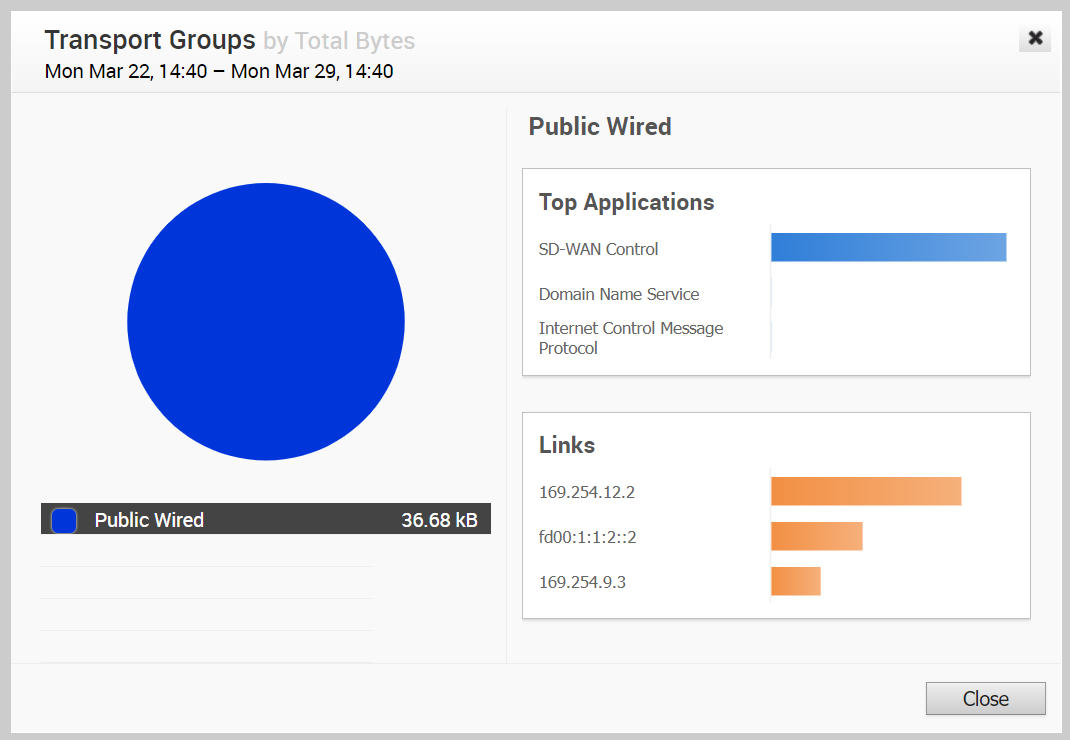
Click Transport Groups to view the links grouped into one of the following categories: Public Wired, Public Wireless, or Private Wired.
You can choose to view the information live by clicking the Start Live Monitoring option. When this mode is enabled, you can view live monitoring of the links and the transport groups. Live monitoring is useful for conducting active testing and calculating Average Throughput. It is also beneficial for troubleshooting security compliance and for monitoring how traffic policies are being leveraged in real time.
In the Live Monitoring screen, select the Show TCP/UDP Details checkbox to view protocol level link usage details.

By default, the Scale Y-axis evenly checkbox is enabled. This option synchronizes the Y-axis between the charts. If required, you can disable this option.
Choose the metrics from the drop-down to view the details related to the selected parameter. The bottom panel displays the details of the selected metrics for the links or the transport groups.
Click the arrow prior to the link name or the transport group to view the break-up details. To view drill-down reports with more details, click the links displayed in the metrics column.
The following image shows a detailed report of transport groups with top applications.
