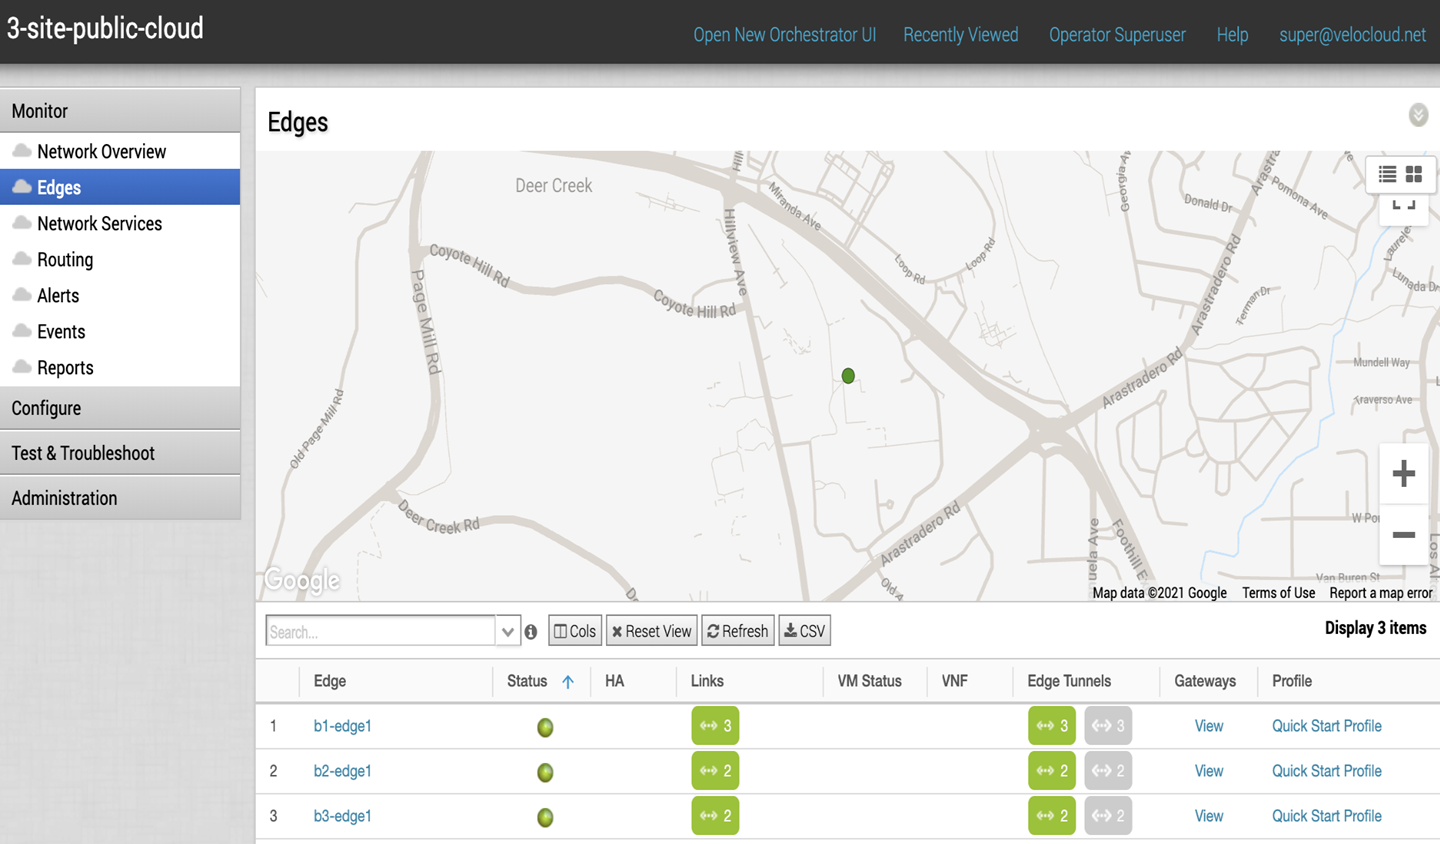
You can monitor the status of Edges and view the details of each Edge like the WAN links, top applications used by the Edges, usage data through the network sources and traffic destinations, business priority of network traffic, system information, details of Gateways connected to the Edge, and so on.
To monitor the Edge details:
- In the Enterprise portal, click .
- The Edges page displays the Edges associated with the Enterprise.

The page displays the following options:
- Table of edges – Lists all edges provisioned in the network.
- Search – Enter a term to search for a specific detail. Click the drop-down arrow to filter the view by specific criteria.
- Cols – Click and select the columns to be shown or hidden in the view. By default, Edge and Status information are displayed.
- Reset View – Click to reset the view to default settings.
- Refresh – Click to refresh the details displayed with the most current data.
- CSV – Click to export all data to a file in CSV format.
Click the link to an Edge to view the details pertaining to the selected Edge. Click the relevant tabs to view the corresponding information. Each tab displays a drop-down list at the top which allows you to select a specific time period. The tab displays the details for the selected duration.
For each Edge, you can view the following details: