


You can monitor the network usage of devices and operating systems for a specific Edge.
Click to view the following:
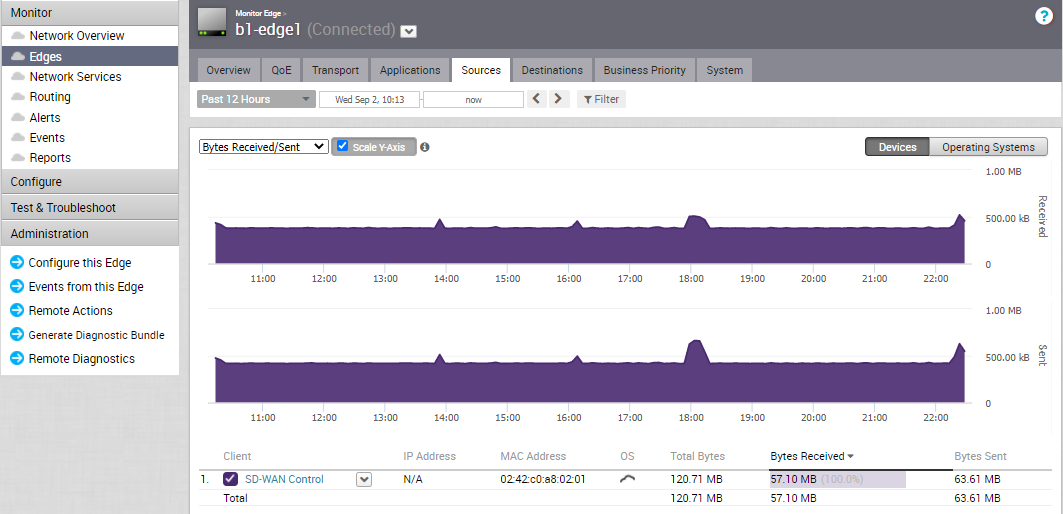
At the top of the page, you can choose a specific time period to view the details of the priorities for the selected duration.
Choose the metrics from the drop-down to view the details related to the selected parameter. For more information on the metrics parameters, see Monitor Edges.
By default, the Scale Y-axis evenly checkbox is enabled. This option synchronizes the Y-axis between the charts. If required, you can turn off this option.
Hover the mouse on the graphs to view more details.
Click Operating Systems to view the report based on the Operating Systems used in the devices.
The bottom panel displays the details of the selected metrics for the devices or operating systems.
To view drill-down reports with more details, click the links displayed in the metrics column.
The following image shows a detailed report of top clients.
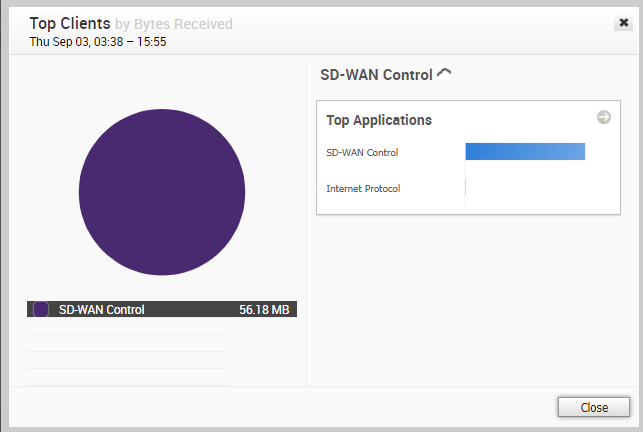
Click the arrows displayed next to Top Applications to navigate to the Applications tab.
