


You can monitor the status of Edges and view the details of each Edge like the WAN links, top applications used by the Edges, usage data through the network sources and traffic destinations, business priority of network traffic, system information, details of Gateways connected to the Edge, and so on.
To monitor the Edge details:
- In the Enterprise portal, click the Open New Orchestrator UI option available at the top of the Window.
- Click Launch New Orchestrator UI in the pop-up window. The UI opens in a new tab.
- Click to view the Edges associated with the Enterprise. The page displays the details of the Edges like the status, links, Gateways, and other information.
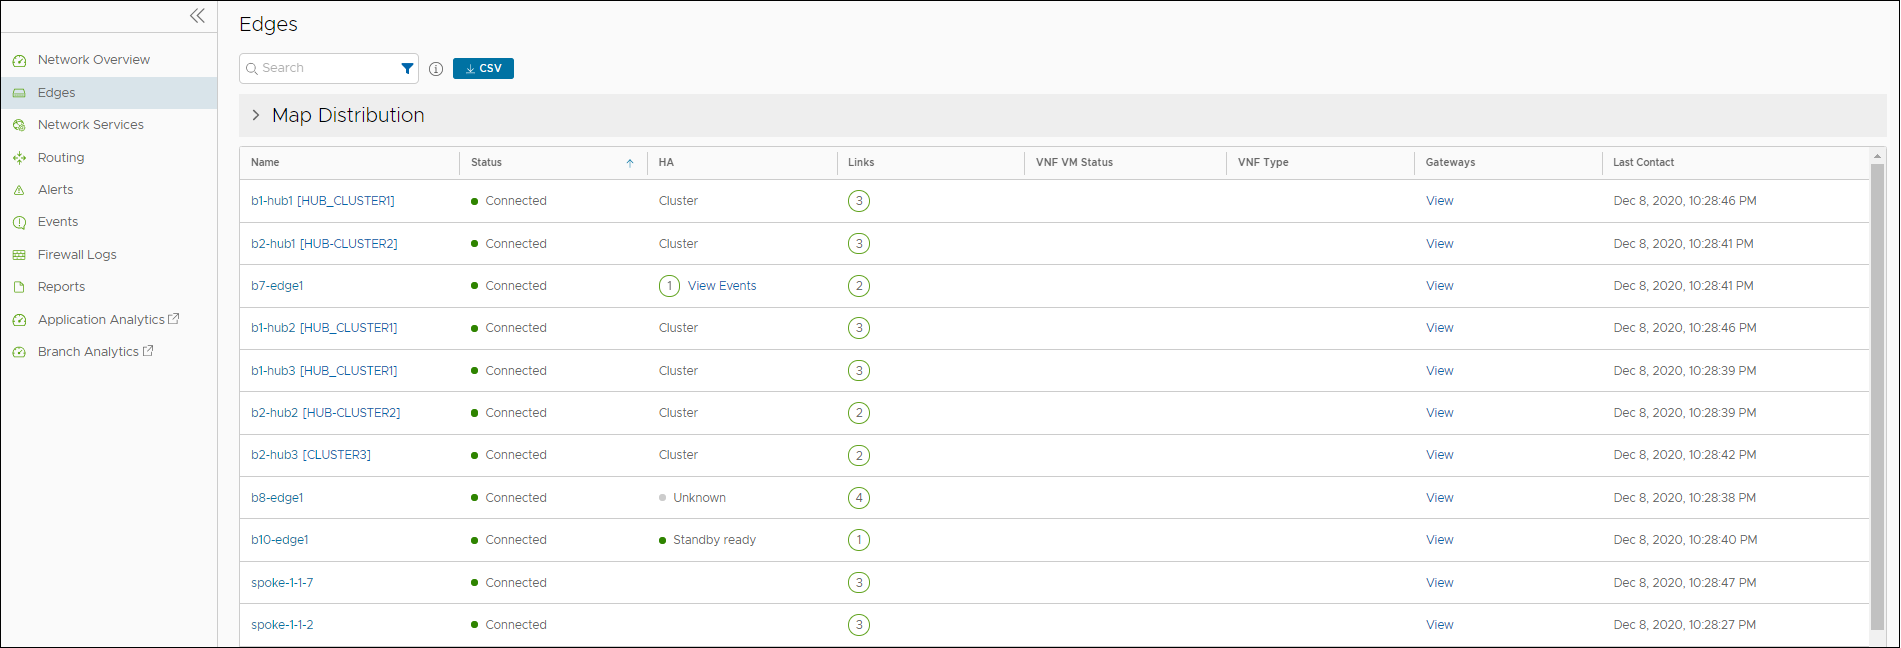
You can use the Search option to view specific Edges. Click the Filter Icon in the Search option to define a criterion and view the Edge details filtered by Edge Name, Status, Created Date, Serial Number, Custom Info, and so on.
Click the CSV option to download a report of the Edges in CSV format.
You can click the link to View option in the Gateways column to view the details of Gateways connected to the corresponding Edge.
- Columns: Allows to select the columns to be shown or hidden in the view.
- Refresh: Displays the details in the page with the most current data.
Click the link to an Edge to view the details pertaining to the selected Edge. Click the relevant tabs to view the corresponding information. Each tab displays a drop-down list at the top which allows you to select a specific time period. The tab displays the details for the selected duration.
Some of the tabs provide drop-down list of metrics parameters. You can choose the metrics from the list to view the corresponding data. The following table lists the available metrics:
| Metrics Option | Description |
|---|---|
| Average Throughput | Total bytes in a given direction divided by the total time. The total time is the periodicity of statistics uploaded from the Edge. By default, the periodicity in SD-WAN Orchestrator is 5 minutes. |
| Total Bytes | Total number of bytes sent and received during a network session. |
| Bytes Received/Sent | Split up details of number of bytes sent and received during a network session. |
| Total Packets | Total number of packets sent and received during a network session. |
| Packets Received/Sent | Split up details of number of packets sent and received during a network session. |
| Bandwidth | The maximum rate of data transfer across a given path. Displays both the upstream and downstream bandwidth details. |
| Latency | Time taken for a packet to get across the network, from source to destination. Displays both the upstream and downstream Latency details. |
| Jitter | Variation in the delay of received packets caused by network congestion or route changes. Displays both the upstream and downstream Jitter details. |
| Packet loss | Packet loss happens when one or more packets fail to reach the intended destination. A lost packet is calculated when a path sequence number is missed and does not arrive within the re-sequencing window. A “very late” packet is counted as a lost packet. |
Select an Edge and click the Shortcuts option at the top to perform the following activities:
- Configure – Navigates to the Configuration tab of the selected Edge. See Configure Edges with New Orchestrator UI.
- View Events – Displays the Events related to the selected Edge.
- Remote Diagnostics – Enables to run the Remote Diagnostics tests for the selected Edge. See Run Remote Diagnostics with new Orchestrator UI.
- Generate Diagnostic Bundle – Allows to generate Diagnostic Bundle for the selected Edge. See Diagnostic Bundles for Edges with new Orchestrator UI.
- Remote Actions – Allows to perform the Remote actions for the selected Edge. See Perform Remote Actions with new Orchestrator UI.
- View Profile – Navigates to the Profile page, that is associated with the selected Edge.
- View Gateways – Displays the Gateways connected to the selected Edge.
