


You can monitor the Business policy characteristics according to the priority and the associated network usage data for a specific Edge.
To view the details of business priorities of the network traffic:
Procedure
- In the Enterprise portal, click the Open New Orchestrator UI option available at the top of the Window.
- Click Launch New Orchestrator UI in the pop-up window. The UI opens in a new tab.
- Click to view the Edges associated with the Enterprise.
- Click the link to an Edge and click the Business Priority tab.
Results
The Business Priority tab displays the details of the priorities of the network traffic for the selected Edge.
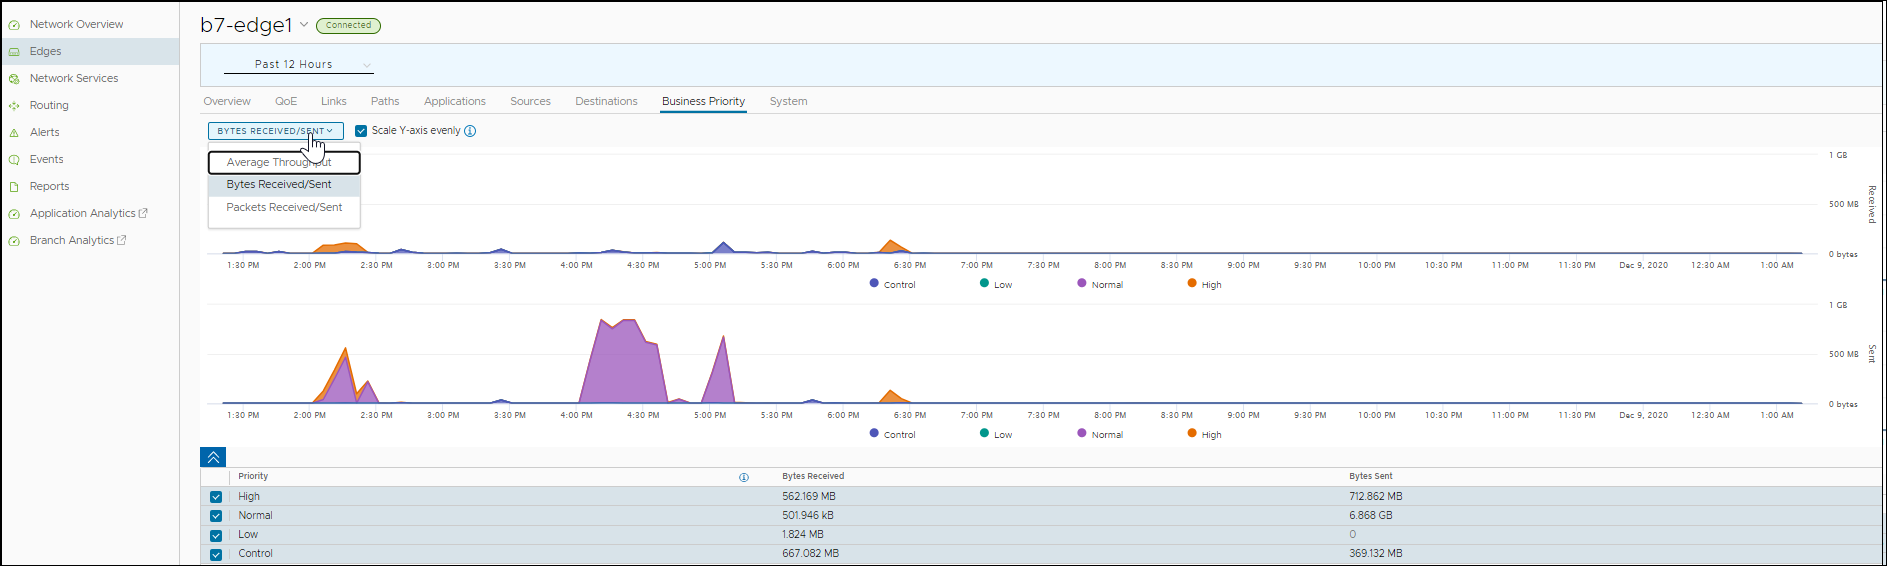
At the top of the page, you can choose a specific time period to view the details of the priorities for the selected duration.
Choose the metrics from the drop-down to view the details related to the selected parameter. For more information on the metrics parameters, see Monitor Edges.
By default, the Scale Y-axis evenly checkbox is enabled. This option synchronizes the Y-axis between the charts. If required, you can turn off this option.
Hover the mouse on the graphs to view more details.
The bottom panel displays the details of the selected metrics for the business priorities.
