


The Overview tab of an Edge in the monitoring dashboard displays the details of WAN links along with bandwidth consumption and network usage.
Procedure
- In the Enterprise portal, click the Open New Orchestrator UI option available at the top of the Window.
- Click Launch New Orchestrator UI in the pop-up window. The UI opens in a new tab.
- Click to view the Edges associated with the Enterprise.
- Click the link to an Edge and the Overview tab is displayed by default.
Results
The Overview tab displays the details of links with status and the bandwidth consumption.
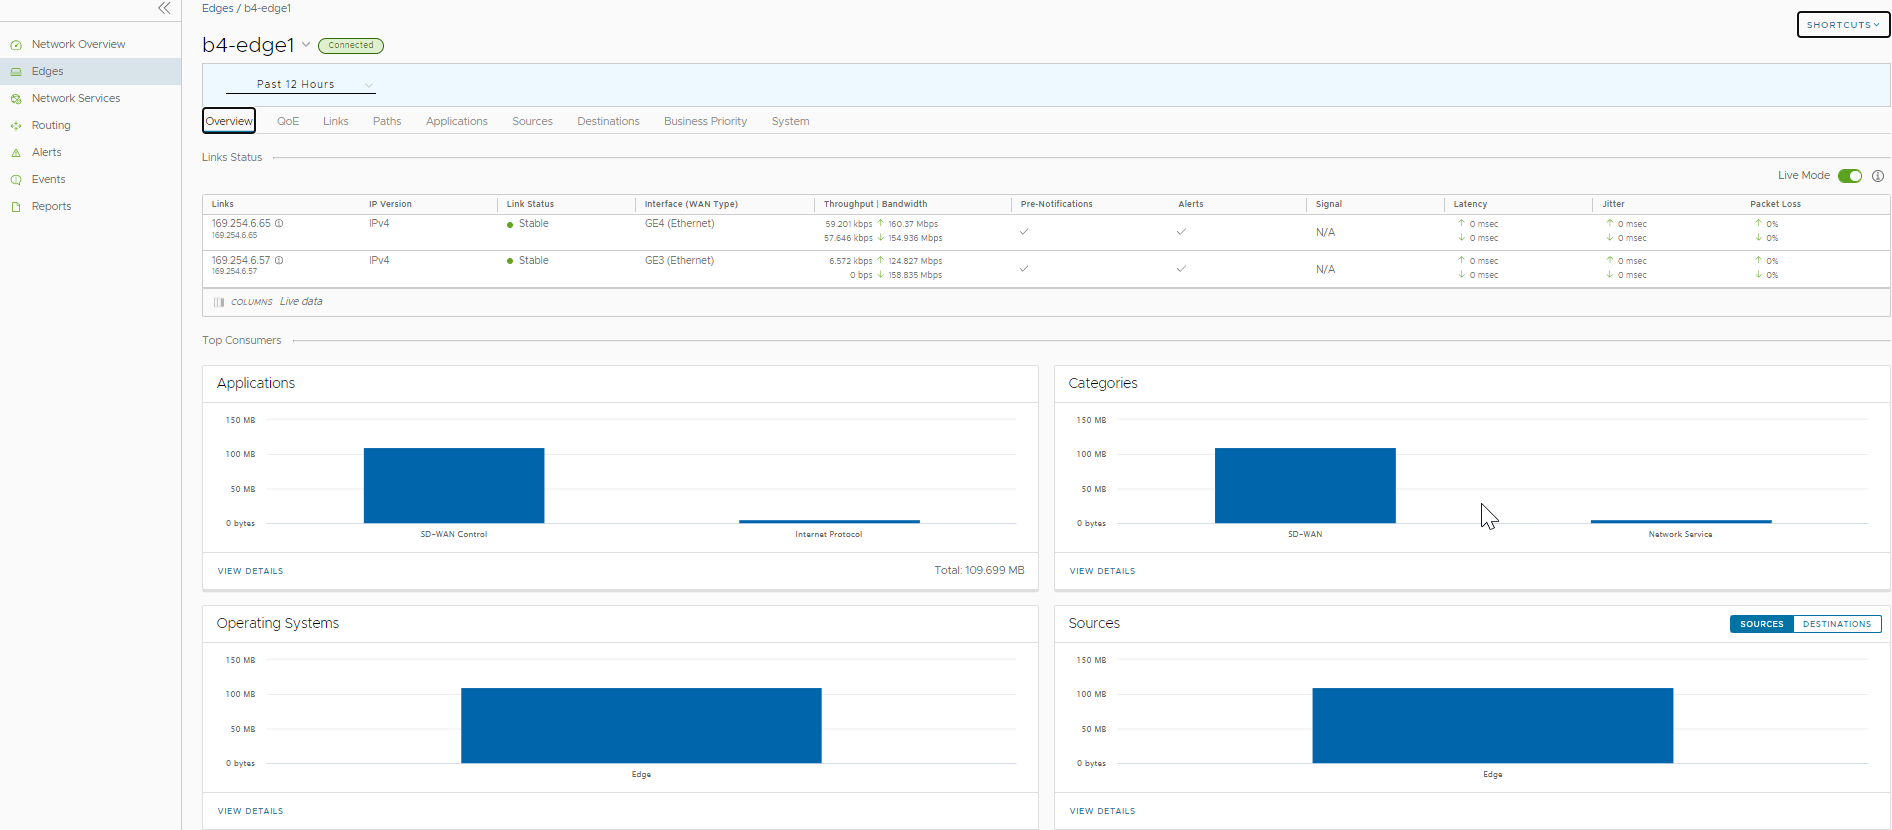
You can choose whether to view the Edge information live using the Live Mode option. When this mode is ON, live monitoring of the Edge happens and the data in the page is updated whenever there is a change. The live mode is automatically moved to offline mode after a period of time to reduce the network load.
The Links Status section displays the details of Links, Link Status, WAN Interface, Throughput, Bandwidth, Signal, Latency, Jitter, and Packet Loss. For more information on these parameters, see Monitor Edges.
The Top Consumers section displays graphical representation of bandwidth and network usage of the following: Applications, Categories, Operating Systems, Sources, and Destinations of the Edges. Click View Details in each panel to navigate to the corresponding tab and view more details.
Hover the mouse on the graphs to view more details.
