


You can monitor the network usage of devices and operating systems for a specific Edge.
To view the details of devices and operating systems:
Procedure
- In the Enterprise portal, click the Open New Orchestrator UI option available at the top of the Window.
- Click Launch New Orchestrator UI in the pop-up window. The UI opens in a new tab.
- Click to view the Edges associated with the Enterprise.
- Click the link to an Edge and click the Sources tab.
Results
The Sources tab displays the details of the client devices used by the selected Edge.
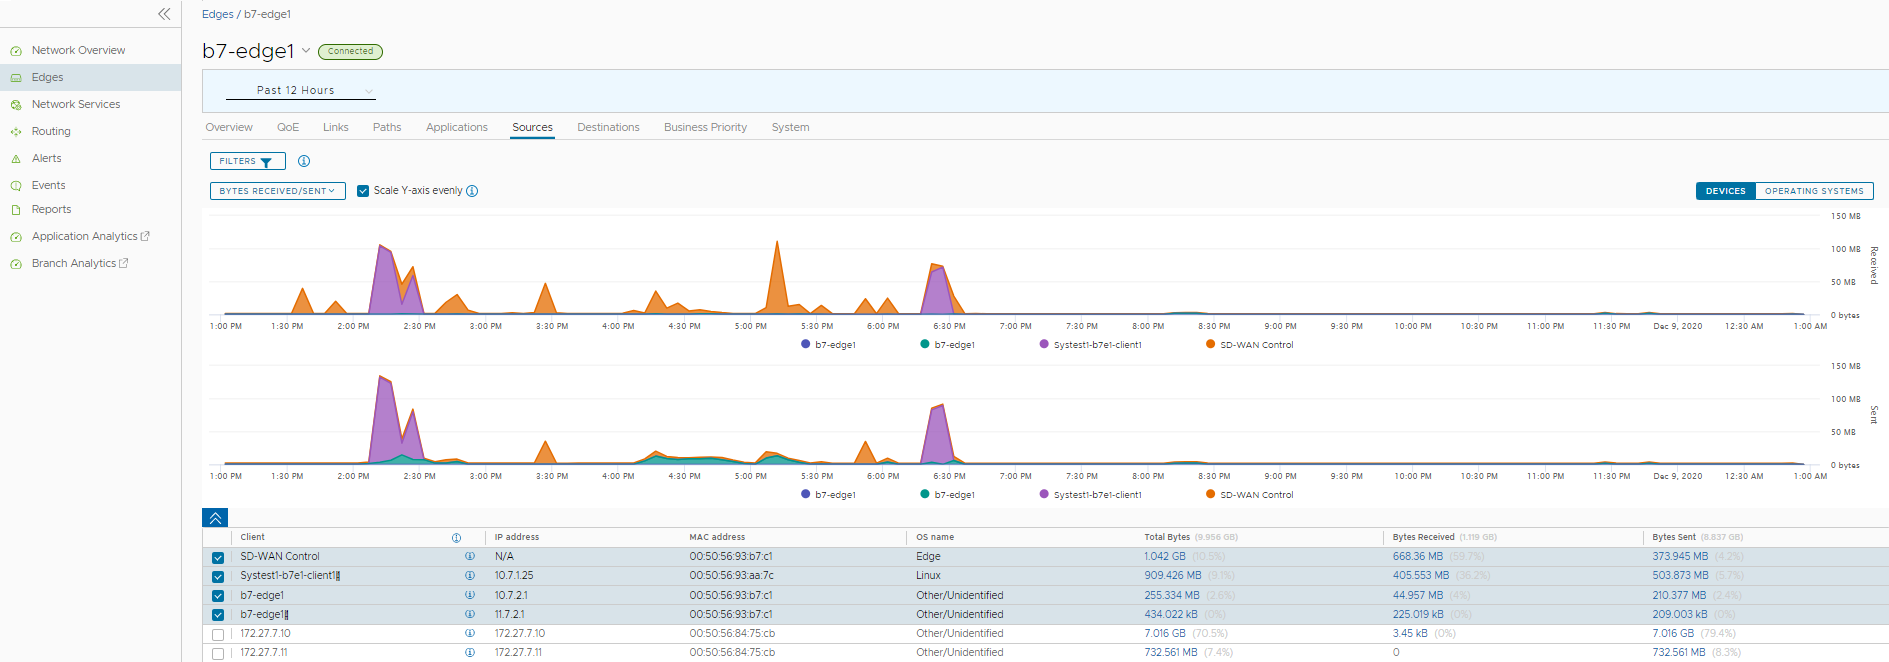
At the top of the page, you can choose a specific time period to view the details of the priorities for the selected duration.
By default, the Scale Y-axis evenly checkbox is enabled. This option synchronizes the Y-axis between the charts. If required, you can turn off this option.
Hover the mouse on the graphs to view more details.
Click Filter to define a criteria and view the application details filtered by the specified criteria.
Click Operating Systems to view the report based on the Operating Systems used in the devices.
Choose the metrics from the drop-down to view the details related to the selected parameter. For more information on the metrics parameters, see Monitor Edges.
The bottom panel displays the details of the selected metrics for the devices or operating systems. You can select and view the details of a maximum of 4 client devices at a time. Click Columns to select the columns to be shown or hidden in the view.
To view drill-down reports with more details, click the links displayed in the metrics column.
The following image shows a detailed report of top clients.
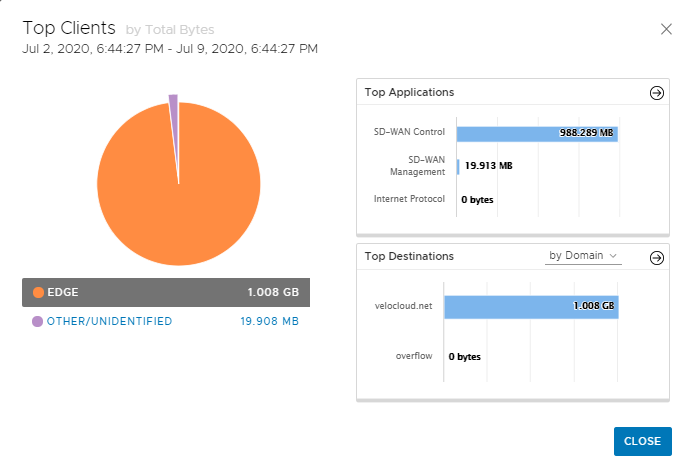
Click the arrows displayed next to Top Applications or Top Destinations to navigate to the corresponding tabs.
