


You can view the detailed network usage by the system for a specific Edge.
To view the details of system information:
Procedure
- In the Enterprise portal, click the Open New Orchestrator UI option available at the top of the Window.
- Click Launch New Orchestrator UI in the pop-up window. The UI opens in a new tab.
- Click to view the Edges associated with the Enterprise.
- Click the link to an Edge and click the System tab.
Results
The System tab displays the details of network usage by the system for the selected Edge.
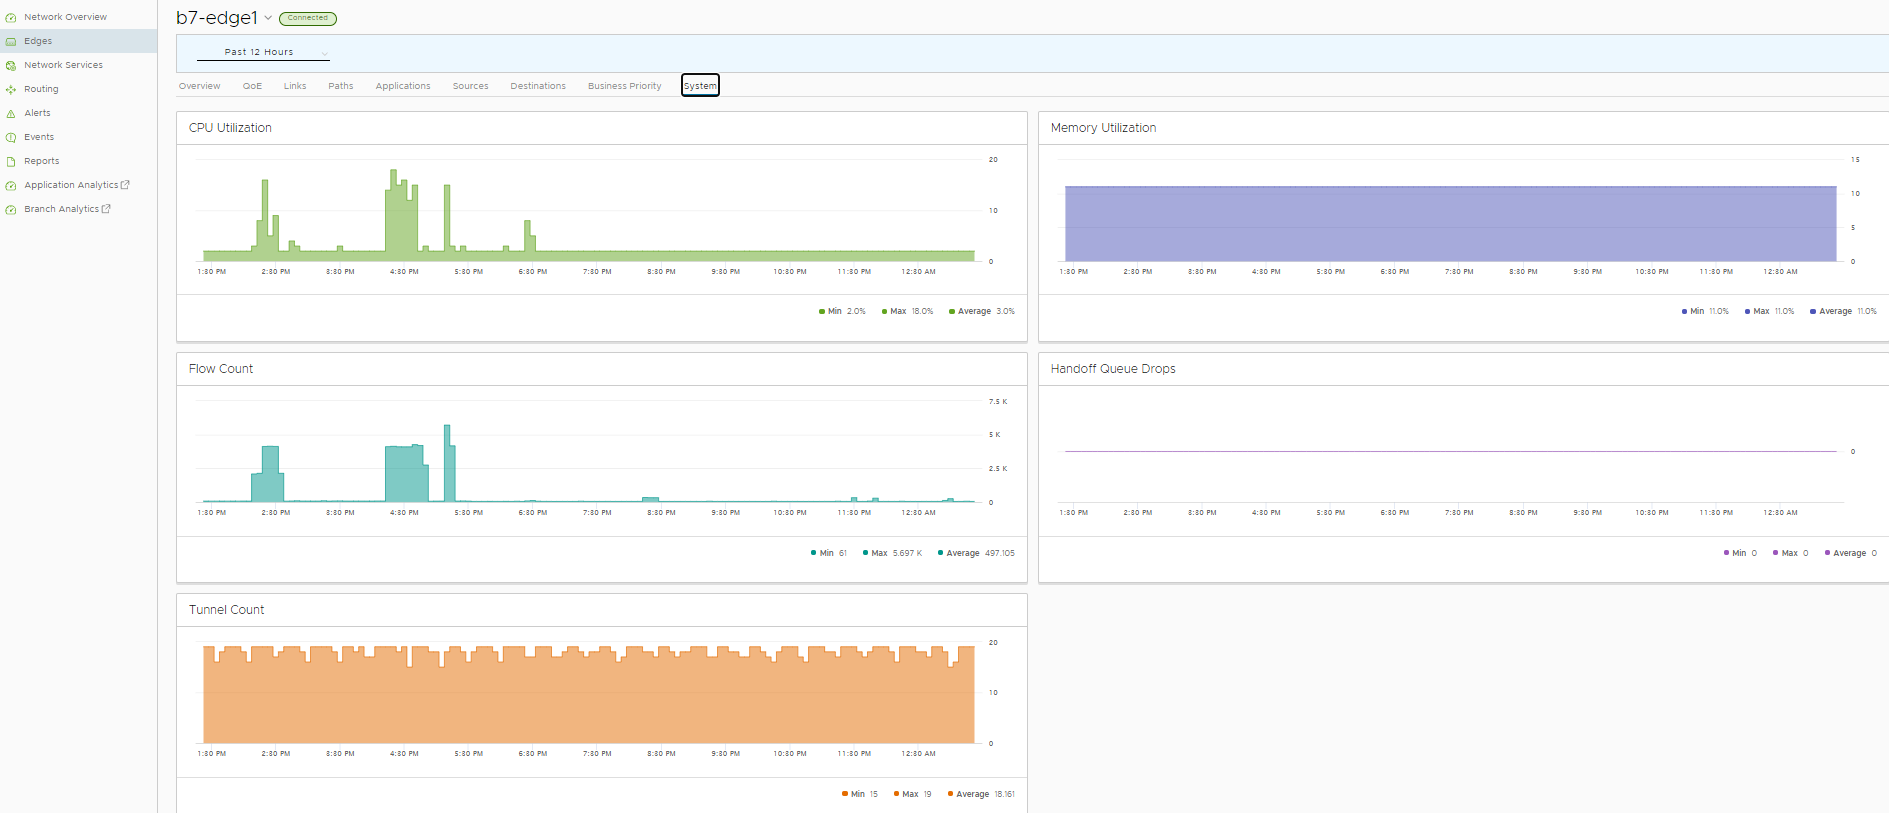
The page displays graphical representation of usage details of the following over the period of selected time duration, along with the minimum, maximum, and average values.
- CPU Utilization – Percentage of usage of CPU.
- Memory Utilization– Percentage of usage of memory.
- Flow Count – Count of traffic flow.
- Handoff Queue Drops – Total number of packets dropped from a queue since the Edge was last rebooted. Occasional drops are expected, usually caused by a large burst of traffic. However, a consistent increase in handoff queue drops usually indicates an Edge capacity issue.
- Tunnel Count – Count of tunnel sessions.
Hover the mouse on the graphs to view more details.
