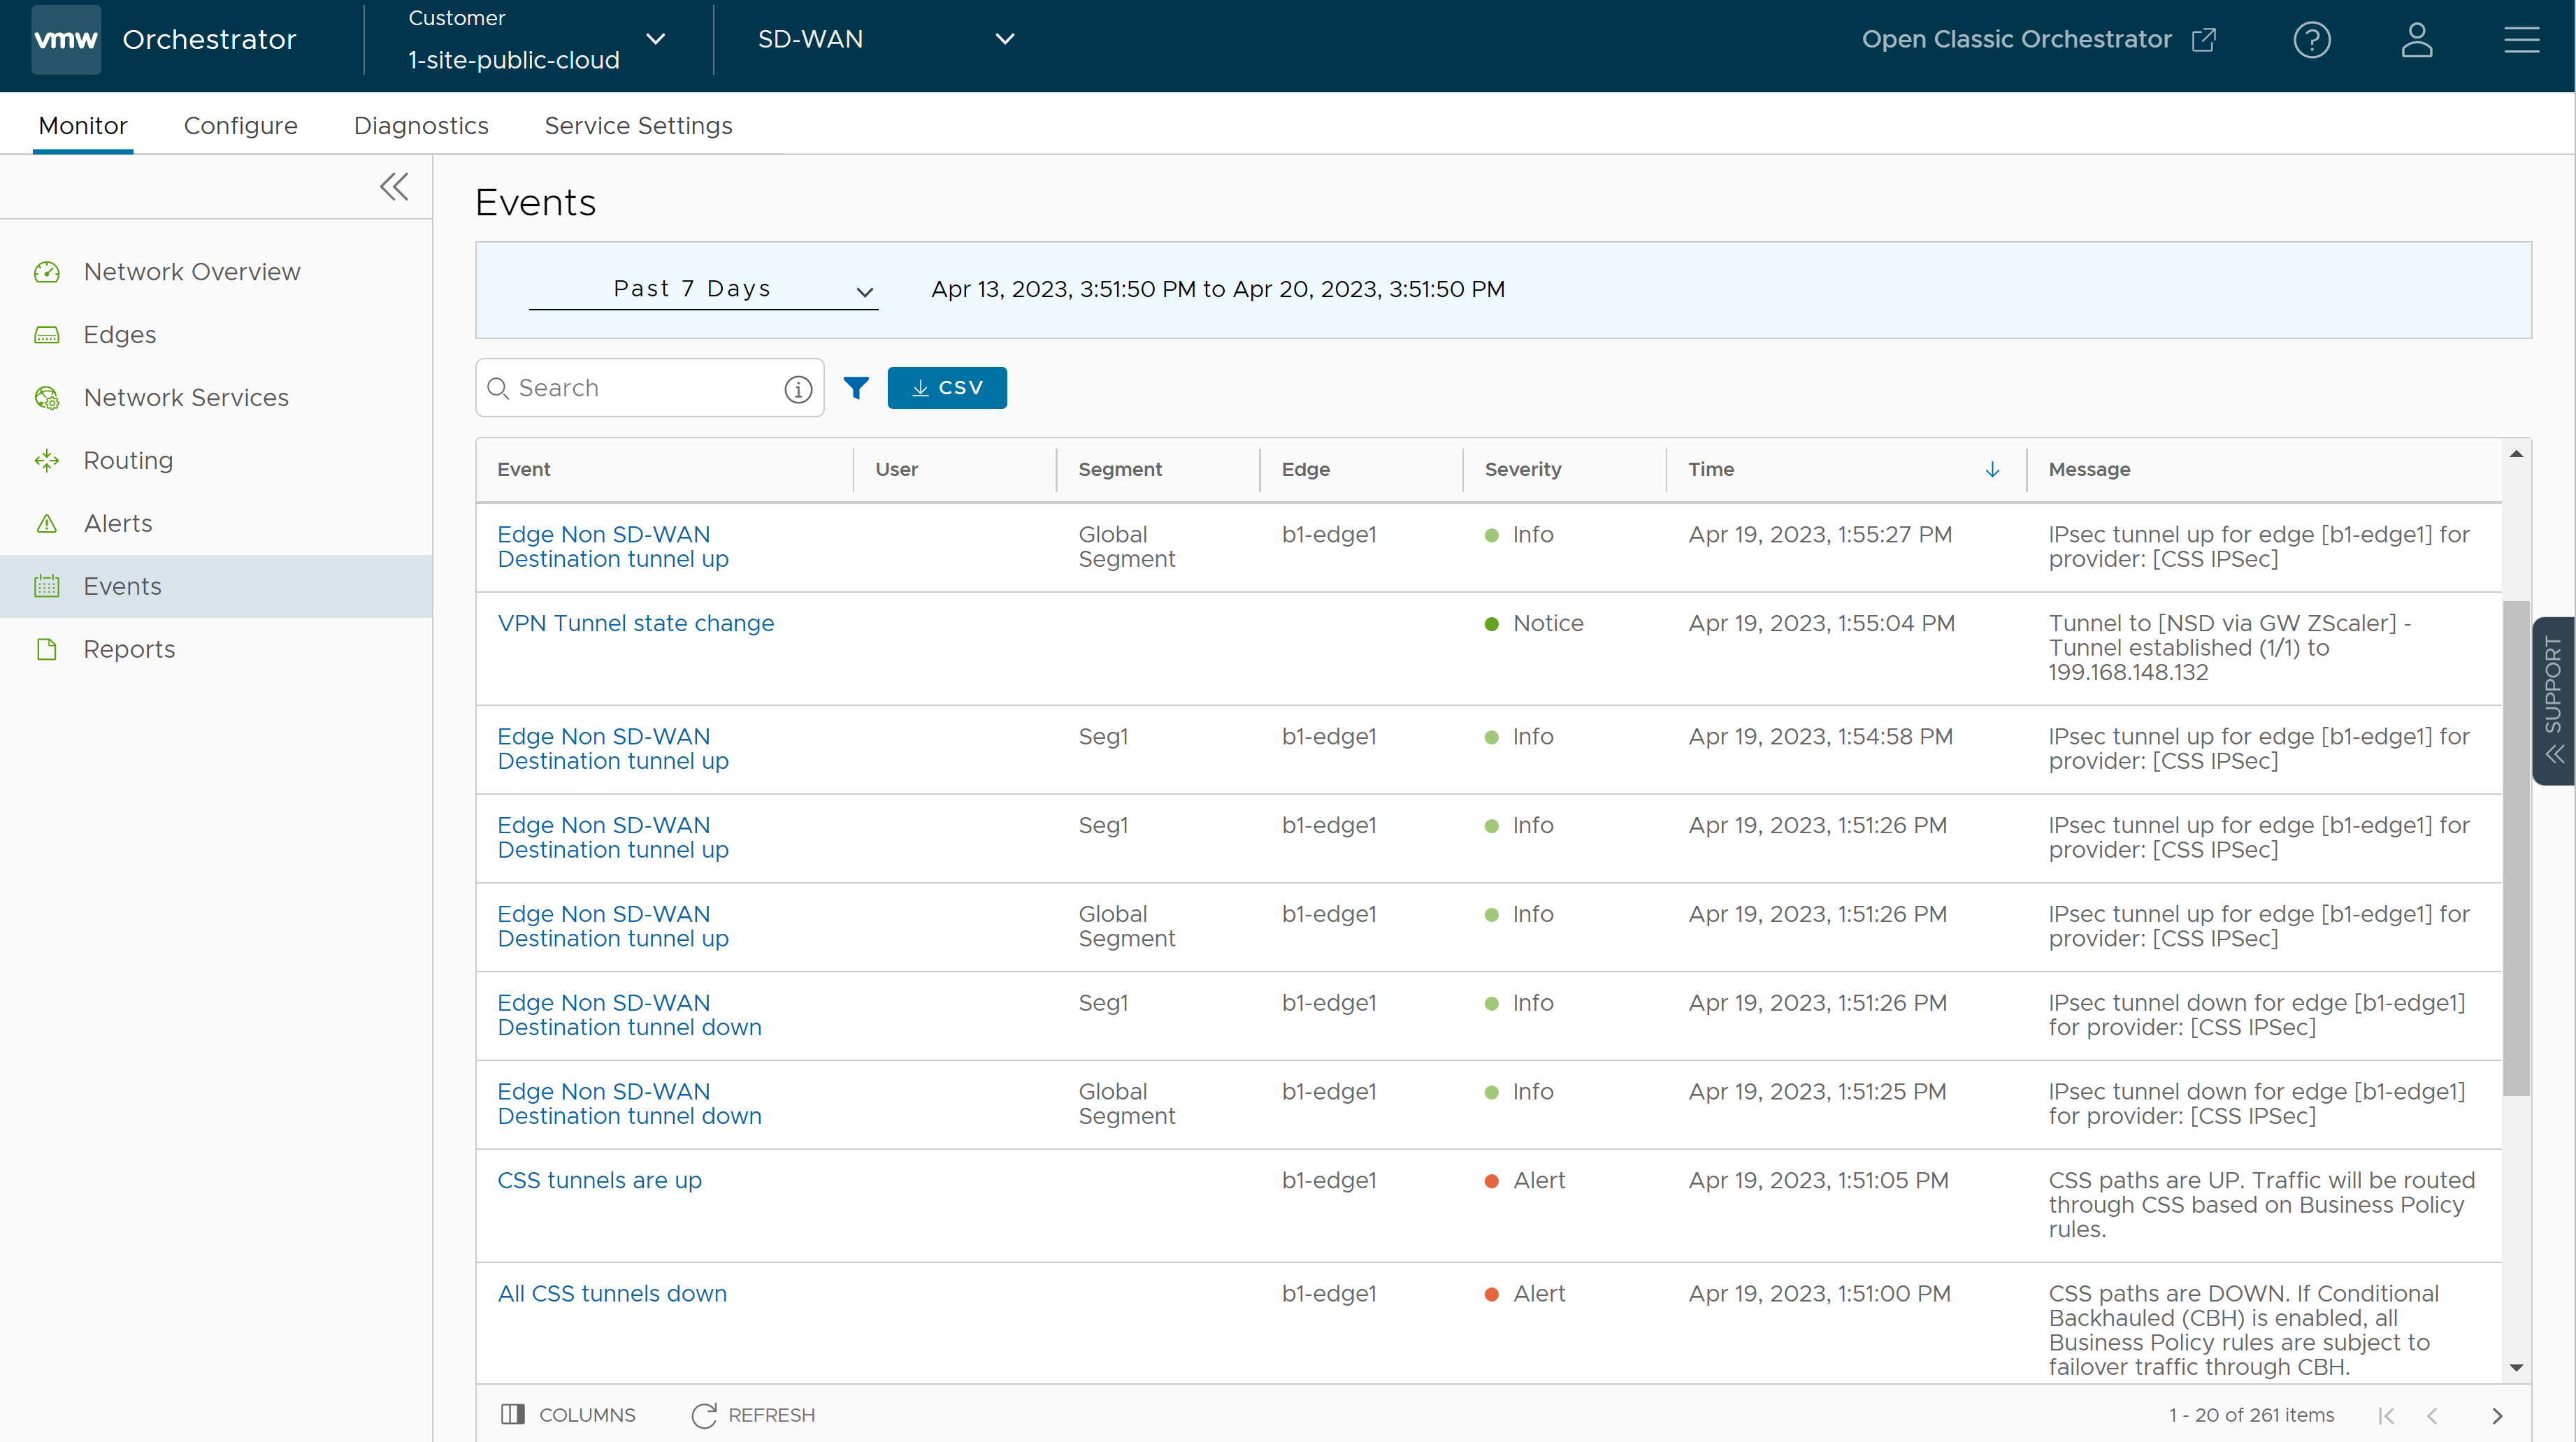
The Events page displays the events generated by the SASE Orchestrator. These events help to determine the operational status of the system.
To view the Events page:
In the SD-WAN service of the Enterprise portal, click Monitor > Events.
The
Events page displays the list of events.
You can choose a specific time period from the drop-down list, to view the events for the selected duration. Click the link to an event name to view more details.
To view details related to specific events, you can use the filter option. Click the Filter Icon in the Search option to define the criteria.
Click the CSV option to download a report of the events in CSV format.
The Events window displays the following details:
Option
Description
Event
Name of the event
User
Name of the user for events that involve the user.
Segment
Name of the segment for segment related events.
Edge
Name of the Edge for Edge related events.
Severity
Severity of the event. The available options are: Alert, Critical, Debug, Emergency, Error, Info, Notice, and Warning.