


VMware SD-WAN allows an Enterprise user to monitor the events and services using a redesigned portal.
In the
SD-WAN service of the Enterprise portal, click
Monitor from the top menu. The following screen appears:
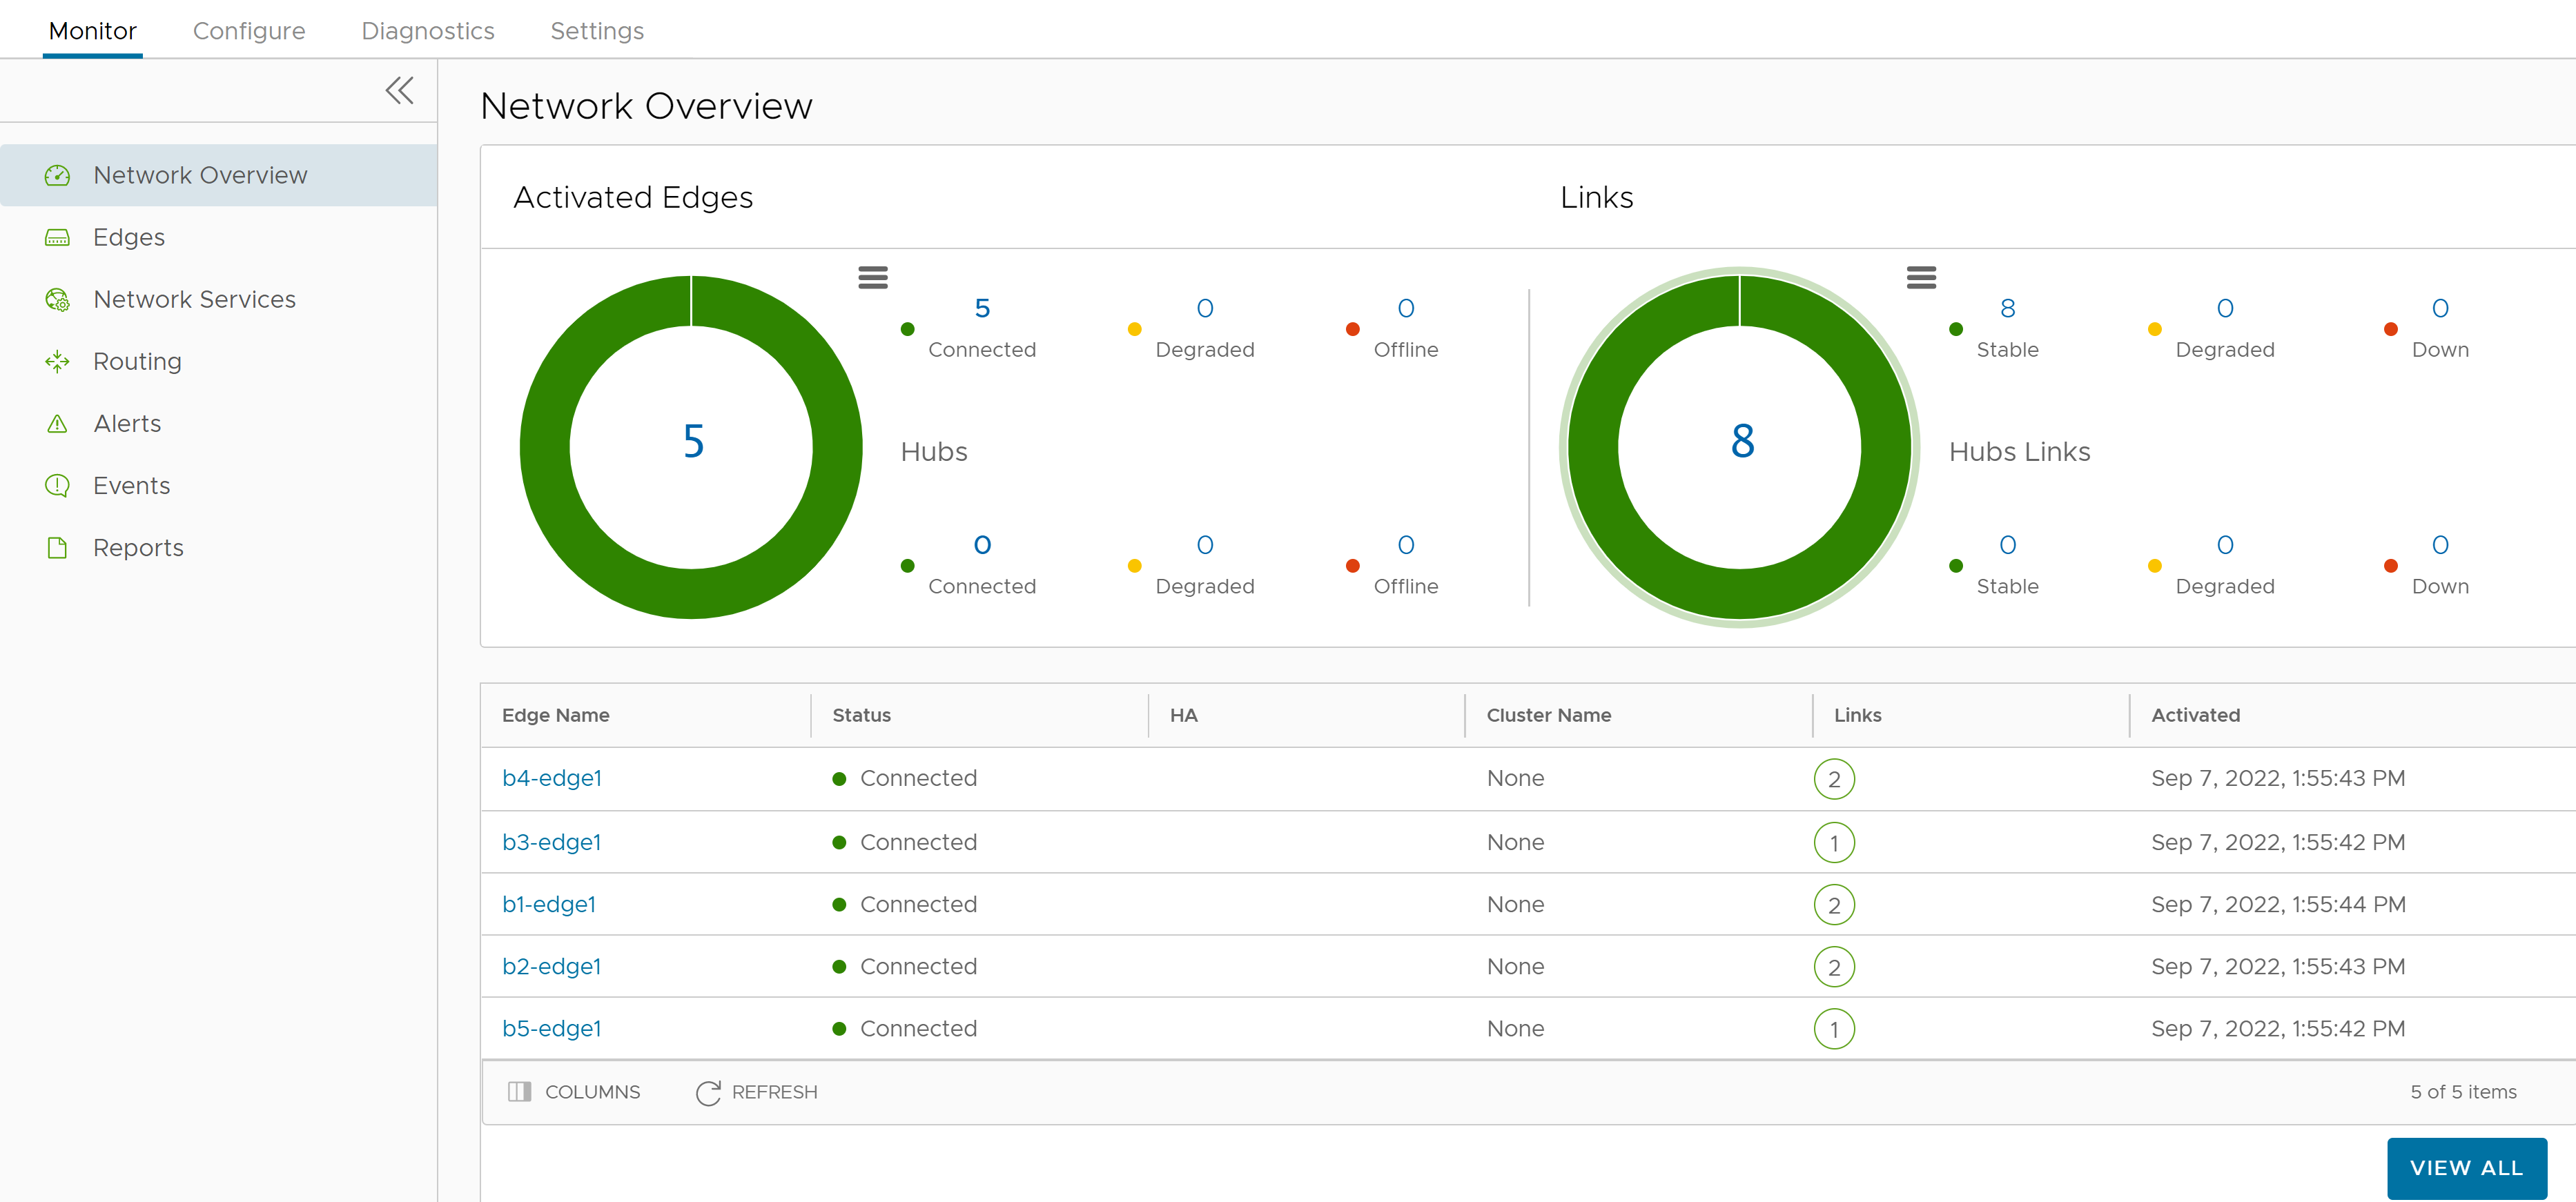
You can explore each monitoring option and click the graphs to view more detailed drill-down reports.
Each monitoring window consists of the following options:
- Search – Enter a term to search for specific details. Click the Filter icon to filter the view by a specific criterion.
- Column – Click and select the columns to be shown or hidden in the view.
- Refresh – Click to refresh the details displayed with the most current data.
