


The Firewall Logs page displays the details of firewall log originating from VMware SD-WAN Edges. Previously the only way a customer could store and view firewall logs was by forwarding them to a Syslog server. With Release 5.2.0 the customer has the option to store firewall logs on the Orchestrator where they can be viewed, sorted, and searched on the Orchestrator UI. By default, Edges cannot send their Firewalls logs to Orchestrator. For an Edge to send the Firewall logs to Orchestrator, ensure that the “Enable Firewall Logging to Orchestrator” customer capability is activated at the Customer level under “Global Settings” UI page. By default, Orchestrator retains the Firewall logs until it reaches the maximum retention time of 7 days or a maximum log size of 15 GB per customer tenant on a rotation basis.
- When a flow is created (on the condition that the flow is accepted)
- When the flow is closed
- When a new flow is denied
- When an existing flow is updated (due to a firewall configuration change)
- If a firewall rule has URL Categories filtering service activated, the URL Category engine looks up the categories of destination URLs and detects if that matches the Blocked or Monitor categories configured. If the URL matches the Blocked categories, the URL Categories engine generates an alert and blocks the Edge traffic. If the URL matches the Monitor categories, the engine allows the Edge traffic and captures the firewall logs.
- If a firewall rule has URL Reputation filtering service activated, the URL Reputation engine looks up the reputation score of the URL and takes action (Allow/Block) based on the minimum reputation configured. If the reputation score of the URL is less than the minimum reputation configured, the Edge blocks the traffic and generates EFS alerts and logs, otherwise allows the traffic. The URL Reputation engine generates EFS logs for the allowed traffic based on the Capture Logs configuration.
- If a firewall rule has Malicious IP filtering service activated, the Malicious IP engine checks if the destination IP is present in the Malicious IP Database (Network Query DB and Local DB). If the engine detects the destination IP in the Malicious IP database, then the engine generates EFS alerts and logs and takes Edge traffic decisions based on the configured action (Block/Monitor).
- If a firewall rule has only the Intrusion Detection System (IDS) activated, the Edges detect if the traffic flow is malicious or not based on certain signatures configured in the engine. If an attack is detected, the EFS engine generates an alert and sends the alert message to SASE Orchestrator/Syslog Server if Firewall logging is activated in Orchestrator and will not drop any packets.
- If a firewall rule has Intrusion Prevention System (IPS) activated, the Edges detect if the traffic flow is malicious or not based on certain signatures configured in the engine. If an attack is detected, the EFS engine generates an alert and blocks the traffic flow to the client only if the signature rule has action as "Reject", matched by the malicious traffic. If the action in the signature rule is "Alert", the engine allows the traffic without dropping any packets even if you configure IPS.
- In the SD-WAN service of the Enterprise portal, navigate to Monitor > Firewall Logs. The Firewall Logs page appears.
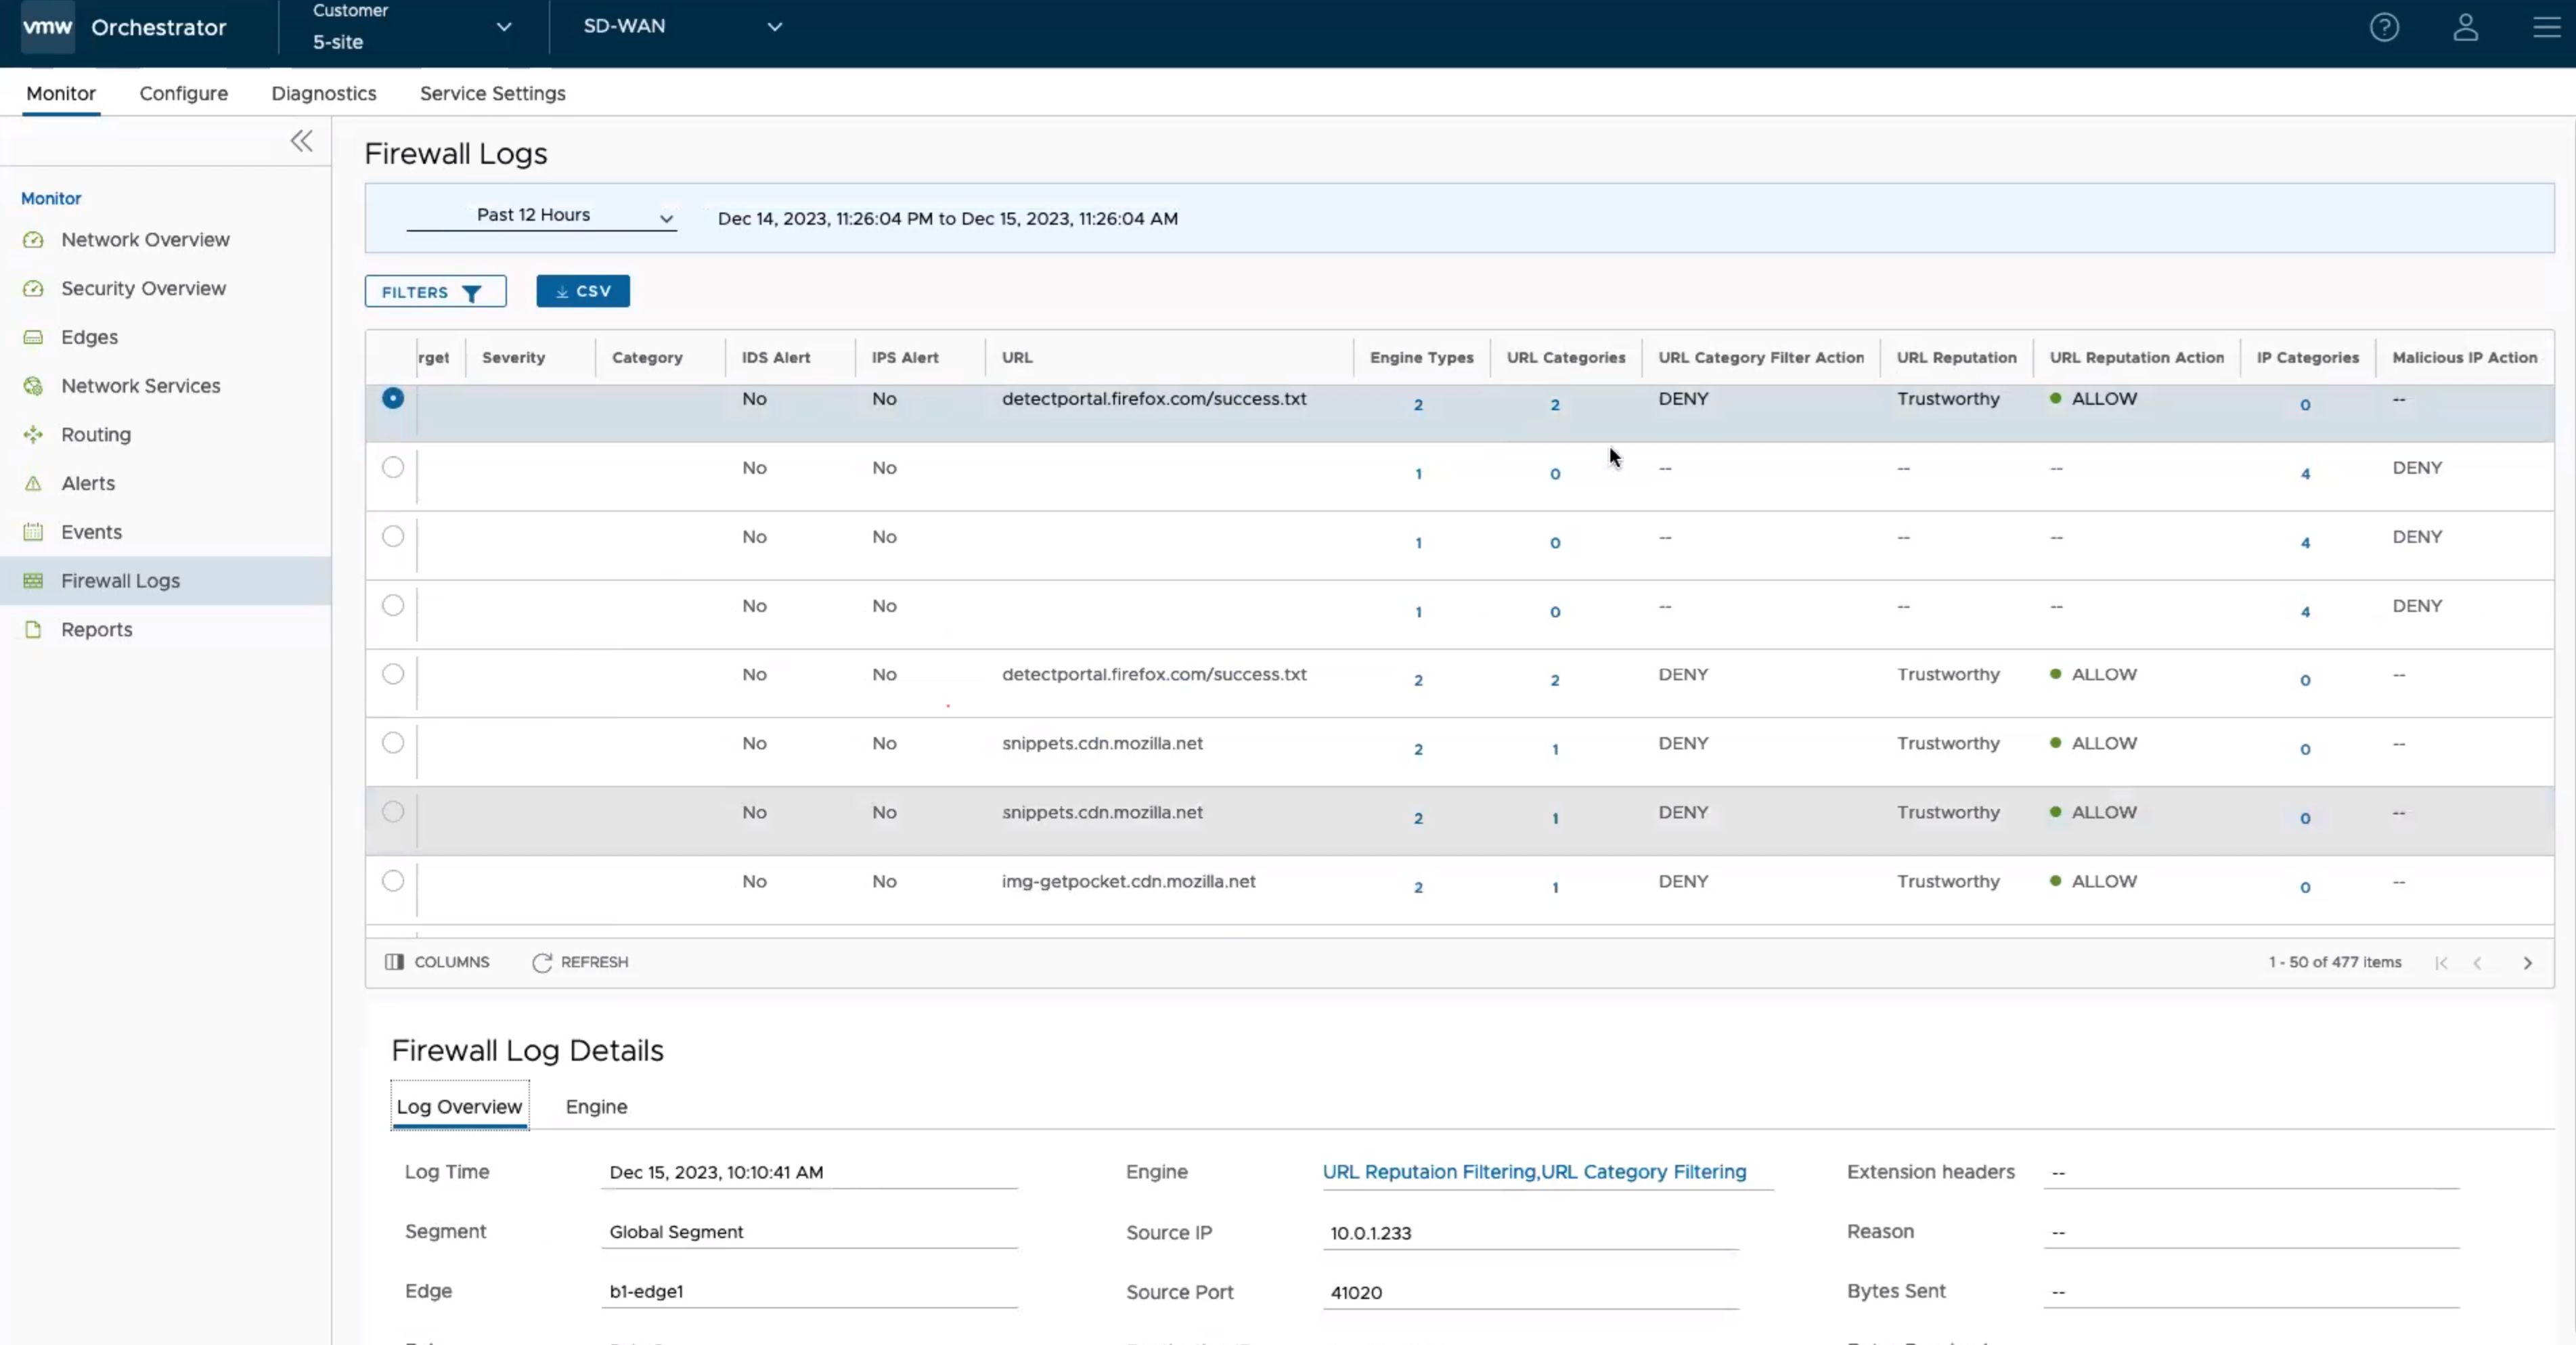
With the Stateful Firewall and Enhanced Firewall Services (EFS) features activated, more information can be reported in the firewall logs. The following table describes all the parameters reported in the firewall logs.
Field Description Time The timestamp of the traffic flow session on which the alert was triggered. Segment The name of the segment to which the session belongs. Edge The name of the Edge to which the session belongs. Action Any of the following actions that were triggered against the event/alert: - Allow
- Close
- Deny
- Open
- Update
Interface The name of the interface on which the first packet of the session was received. In the case of overlay received packets, this field will contain VPN. For any other packets (received through underlay), this field will display the name of the interface in the Edge. Protocol The type of IP protocol used by the session. The possible values are TCP, UDP, GRE, ESP, and ICMP. Source IP The source IP address of the traffic flow session on which the alert was triggered. Source Port The source port number of the traffic flow session on which the alert was triggered. Destination IP The destination IP address of the traffic flow session on which the alert was triggered. Destination Port The destination port of the traffic flow session on which the alert was triggered. Extension Headers The extension headers of the traffic flow packet. Rule The Rule to which the Signature belongs. Reason The reason for closure or denial of the session. This field is available for Close and Deny log messages. Bytes Sent The amount of data sent in bytes in the session. This field is available only for Close log messages. Bytes Received The amount of data received in bytes in the session. This field is available only for Close log messages. Duration The duration for which the session has been active. This field is available only for Close log messages. Application The Application name to which the session was classified by DPI Engine. This field is available only for Close log messages. Destination Domain The destination domain of the traffic flow session. Destination Name The name of the destination device of the traffic flow session. Session ID The Session ID of the traffic flow on which the alert was triggered. Signature ID A unique ID of the signature rule. Signature The Signature installed on the Edge. Attack Source The Source of the attack. Attack Target The Target of the attack. Severity The severity of the intrusion. Category The category type to which the intrusion belongs. IDS Alert Displays "Yes" if the alert notification is received from the IDS engine, or else displays "No". IPS Alert Displays "Yes" if the alert notification is received from the IPS engine, or else displays "No". URL The URL of the destination to which the traffic flow was directed. Engine Types Total count of Engine types that match the flow. Click the link in this column to view the Engine types that match the flow. URL Categories Total count of URL category types that matches the flow. Click the link in this column to view the URL categories that matches the flow. URL Category Filter Action The URL Category Engine-specific filtering action: - Block
- Monitor
URL Reputation The URL Reputation type defined in the policy rule. URL Reputation Action The URL Reputation Engine-specific filtering action: - Block
- Monitor
IP Categories Total count of threat types that match the flow. Click the link in this column to view the IP categories that match the flow. Malicious IP Action The Malicious IP Engine-specific filtering action: - Block
- Monitor
Note: Not all fields will be populated for all firewall logs. For example, Reason, Bytes Received/Sent and Duration are fields included in logs when sessions are closed. Signature ID, Signature, Attack Source, Attack Target, Severity, Category, IDS Alert, IPS Alert, URL, Engine Types, URL Categories, URL Category Filter Action, URL Reputation, URL Reputation Action, IP Categories, and Malicious IP Action are populated only for EFS alerts, not for firewall logs. - You can use the Filter options and select a filter from the drop-down menu to query the Firewall logs.
- To view more detailed information about a specific Firewall log, select the Firewall log entry. Under the Firewall Log Details section, you can view the detailed Log Overview and Engine information for the selected log entry.
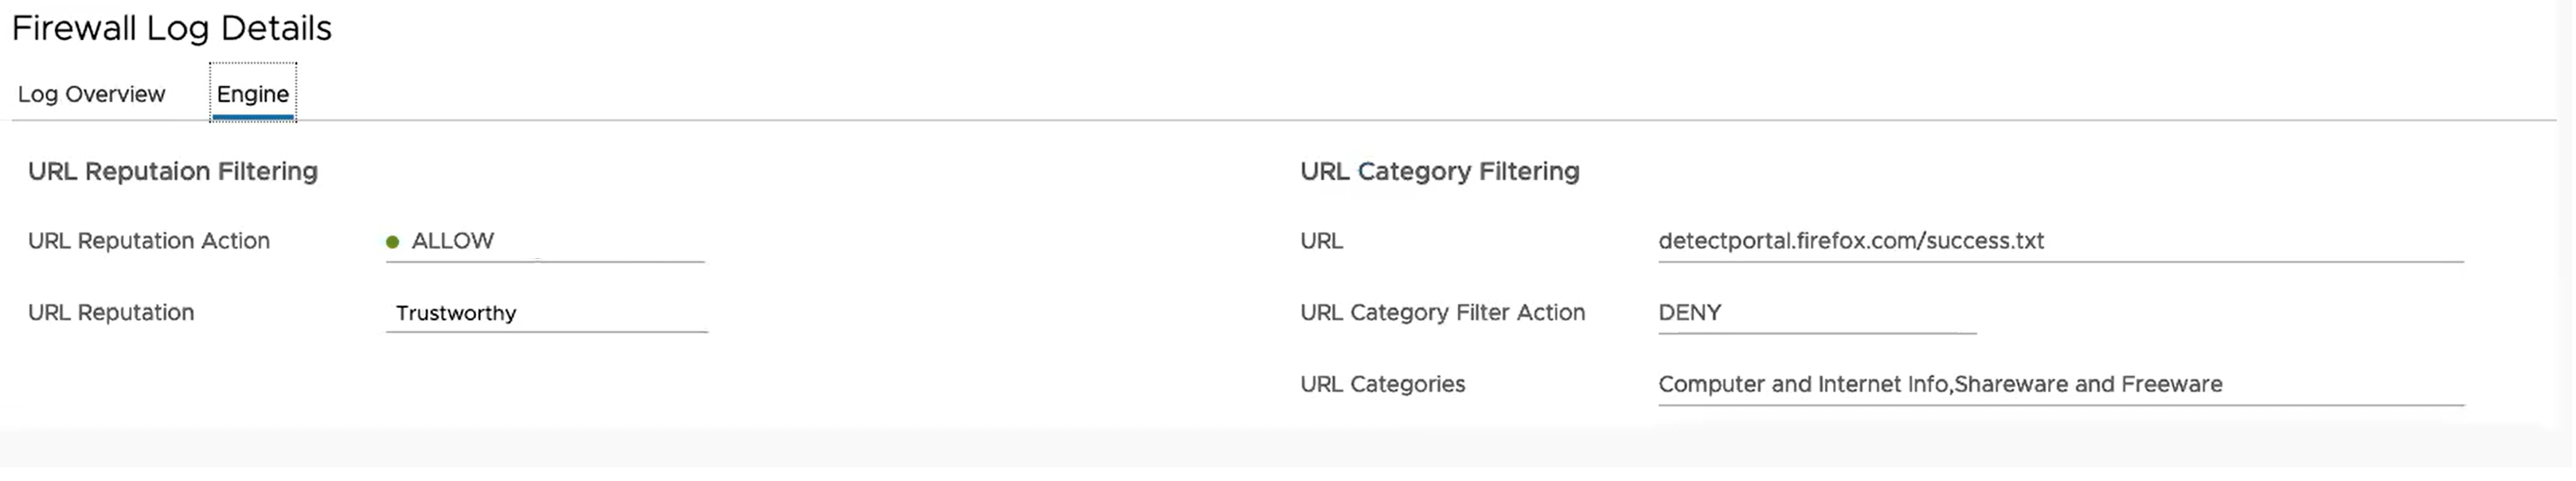
Note: If the selected Firewall log entry is generated by Engines other than Enhanced Security Services, the Engine tab will not be available.
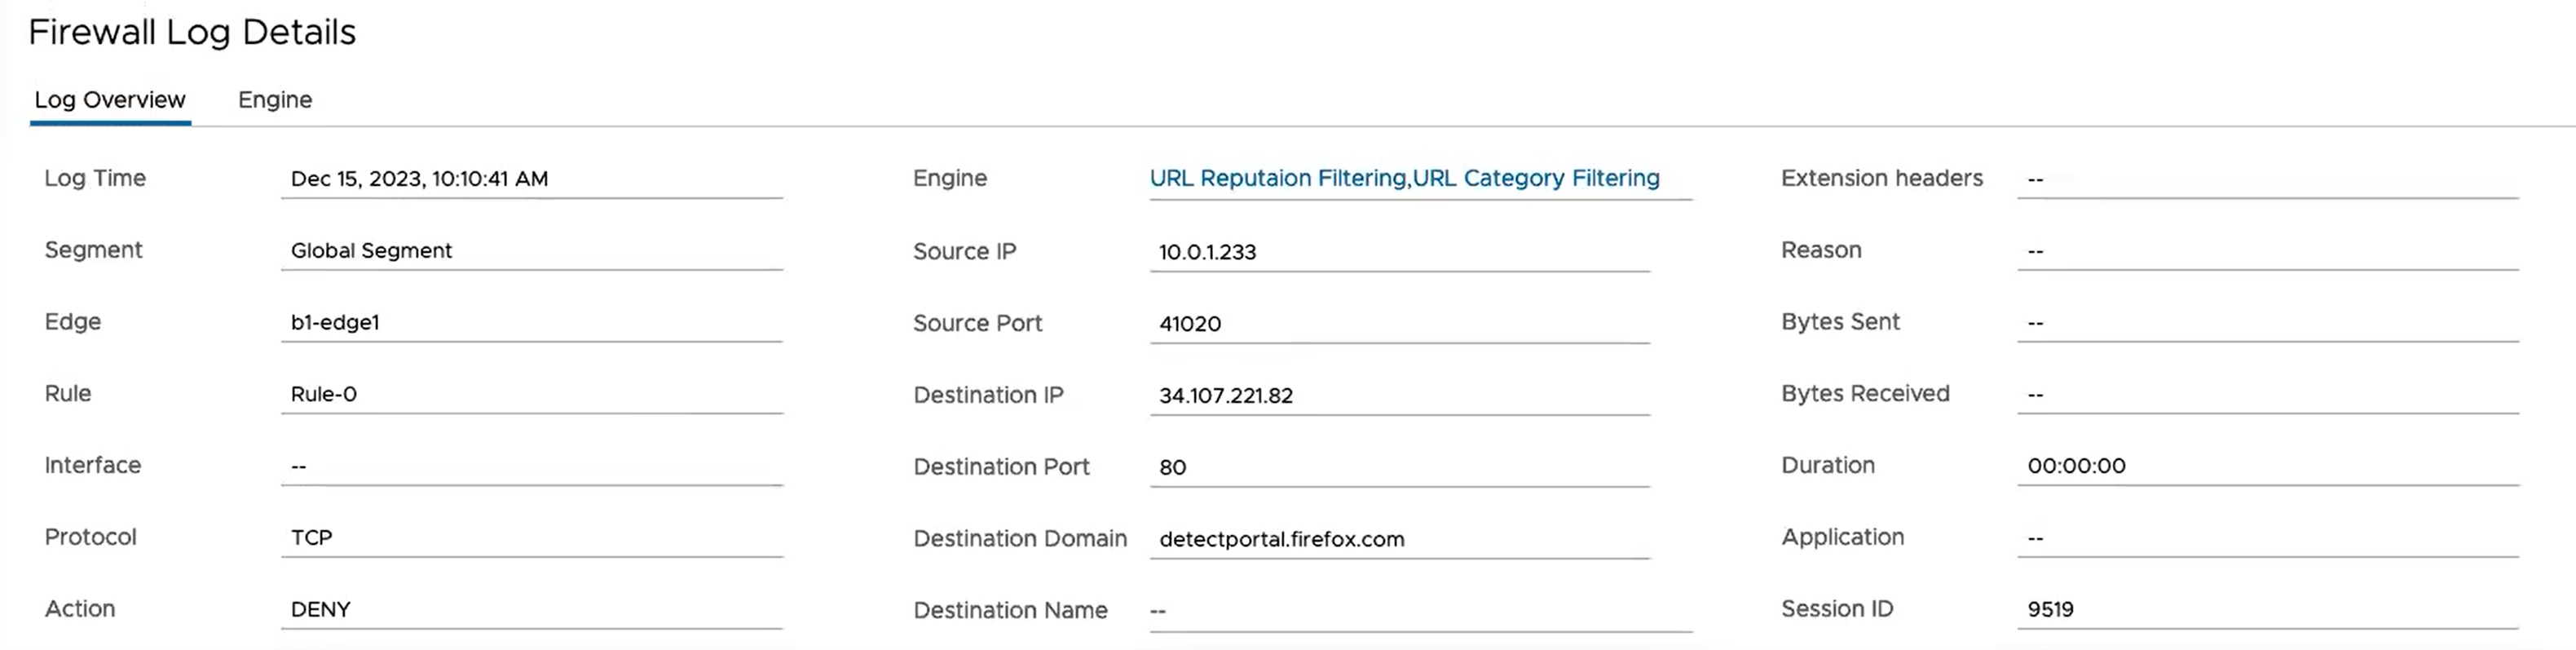
- In the Log Overview tab, click the link next to Engine to view detailed information about the specific Engine that matched the flow along with the Engine-specific filtering action.
- To create customized reports by exporting Edge Firewall Logs data in CVS format, in the Firewall Logs page, click the CSV option.
