


The Flow Visibility feature introduces a new Flows tab to the Orchestrator UI in the 5.1.0 release, which provides detailed data on each traffic flow for each Edge. The comprehensive end-to-end flow is built based on certain flow parameters, such as Source IP, Destination IP & Port, and Protocol. These parameters are displayed in a single view table format, which can assist with monitoring and troubleshooting efforts.
Procedure
- In the SD-WAN service of the Enterprise portal,, click to view the Edges associated with the Enterprise.
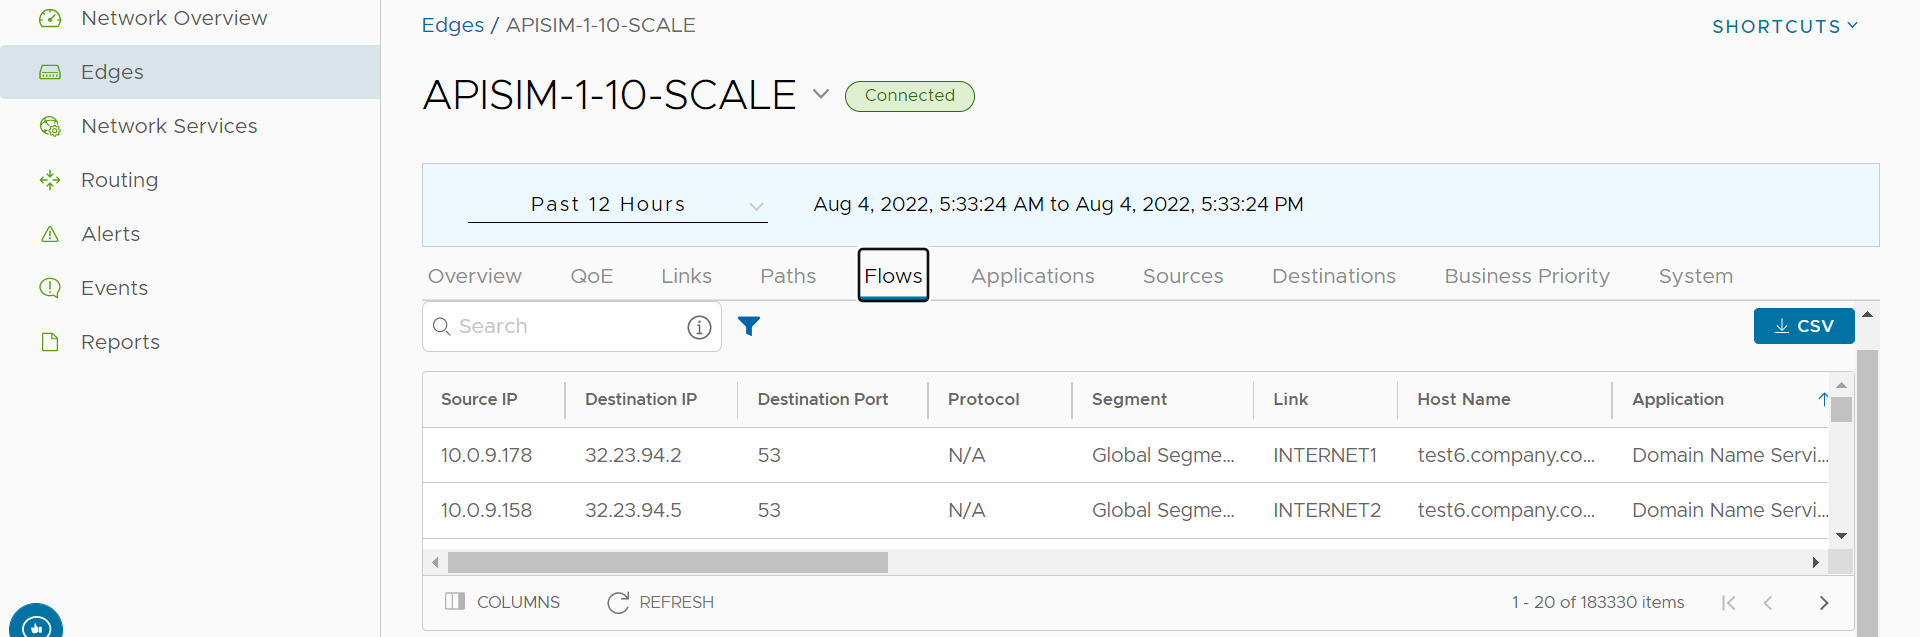
- Click the link of an Edge, and then click the Flows tab.
For the selected Edge, the
Flows tab displays the details of the SD-WAN Edge for a specified period. See image below.
Note: For the
Flows feature, the unselected table fields are only available for Edges with software image version 5.1 or later.
The
Flows tab displays detailed flow information about an Edge. See the table below for a description of the text fields, icons, and columns in the
Flows tab area.
| Field Item | Description |
|---|---|
| Specified Time text field | Provides time filter capabilities from the past 60 minutes to 1 year (from 0-14 days, high resolution data is displayed, after which low resolution data up to one year is displayed). Custom filter capabilities are also available. At the top of the page, choose a specific time period to view the details of the priorities for the selected duration. |
| Search | Provides Search capabilities to find a specific flow parameter. Enter a search string to find text that matches in the Source IP, Destination IP, Destination FQDN, and Destination Domain fields. Use the Advanced Search feature for more advanced filtering criteria. |
| Filter | Provides Filter capabilities based on Flow parameters; such as, Source IP, Destination IP, Destination Port, Segment, Host Name, Application, Category, Destination FQDN, Destination Domain, and Next Hop.
Note: The client device table filters hostname; however, the values are shown in accordance with what was uploaded by the flow stats that were uploaded to the flow stats table. As a result, the hostname can be null, or it might not correspond to the hostname that is being filtered. In essence, it displays the value submitted at the time the flow was uploaded.
|
| Export | Provides capability to create customized reports by exporting flow data in CVS format. NOTE: A user can download the first 60K records matching the filter/quickSearch/sortBy/startTime/endTime criteria when the metrics/getEdgeFlowVisibilityMetrics request was made. |
| Field Item | Description |
|---|---|
| Source IP | Displays the IP address that owns the flow item. This information is also available on the Source tab and can be mapped to the name of the client device/operating system. |
| Destination IP | Displays flow data of the Destination (Domain, FQDN, and IP). This information can also be found in the Destination tab. |
| Destination Port | Displays the destination port number, which identifies the process that is to receive the data. |
| Protocol | Displays Protocols (e.g. UDP, TCP). |
| Segment | Routing domain. Each segment has a unique routing table. |
| Link | Underlying link through which the flow stats are reported. |
| Host Name | The hostname associated with the source device of the flow. |
| Application | Column that displays the application. This information can also be found in the Application tab. |
| Application Category | Similar applications that are used by a specific Edge can be grouped into a category. |
| Destination FQDN | The Fully Qualified Domain Name (FQDN) of the Destination to which the traffic flow was directed. |
| Next Hop | The name of Next Hop device for the flow (i.e., The name of the Gateway if the route is Cloud via Gateway). See the Route to Nexthop Mapping table in the section below. |
| Route | The path taken to the next hop across one or more networks. |
| Start Time | The timestamp of when the Edge started the flow stats aggregation period. |
| End Time | The timestamp of when the Edge ended the flow stats aggregation period. The difference between start and end times equals the amount of time a flow stat record was aggregated for. |
| Total Bytes | Displays the total number of bytes sent and received during a flow. |
| Bytes Received | Displays details of the number of bytes received during a flow. |
| Bytes Sent | Displays details of the number of bytes sent during a flow. |
| Total Packets | Total number of packets sent and received during a flow. |
| Packets Received | Displays details of the number of packets received during a flow. |
| Packets Sent | Displays details of the number of packets sent during a flow. |
| Route Name | Nexthop |
|---|---|
| cloudViaGateway | The name of the Gateway that routes traffic to the cloud. |
| internetViaDirectBreakout | Nexthop has no name. The traffic is coming from the Internet directly. |
| branchToBranch (Gateway) | The name of the Gateway responsible for routing traffic to the other branch. |
| branchToBranch (Edge) | The name of the Edge that was used to route traffic to the other branch. |
| branchToNVSDirect | The name of the HUB device serving as the nexthop Edge. |
| branchToNVSViaGateway | The name of the Gateway that routes traffic to NVS. |
| branchToBackhaul | The name of the Edge or enterprise object that is used to route traffic to a non-velocloud site. |
| cloudViaGateway (Edge – to Partner Gateway) | The nexthop is the name of the Partner Gateway that will route the traffic. |
| branchRouted | Nexthop has no name. For basic routed traffic, there is no destination object, specifically, via an Edge router. |
| internetViaBranchCSS | Name of enterprise object used to route traffic to a non-velocloud branch. |
