


You can monitor the status of Edges and view the details of each Edge, like the WAN links, top applications used by the Edges, usage data through the network sources and traffic destinations, business priority of network traffic, system information, details of Gateways connected to the Edge, and so on.
To monitor the Edge details:
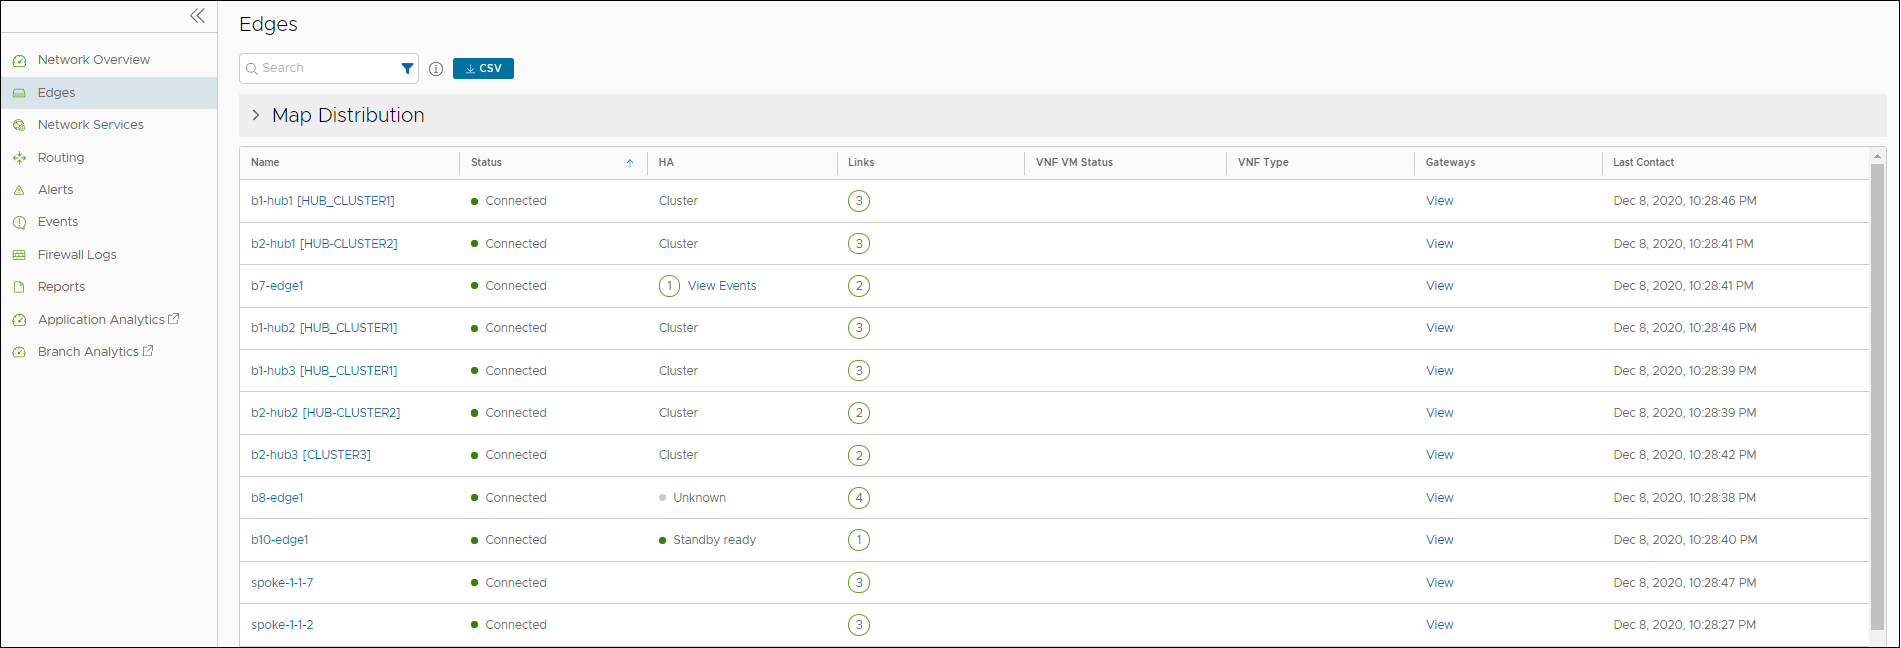
Click CSV to download a report of the Edges in CSV format.
Click View in the Gateways column to view the details of the Gateways connected to the corresponding Edge.
Click an Edge name in the Name column to view the details of the selected Edge. Click the relevant tabs to view the corresponding information. Each tab displays a drop-down list at the top which allows you to select a specific time period. The tab displays the details for the selected duration.
Some of the tabs provide drop-down menu of metrics parameters. You can choose the metrics from the list to view the corresponding data. The following table lists the available metrics:
The following table describes each drop-down menu that are available in the Links, Applications, Sources, Destinations, and Business Priority tabs.
| Metrics Option | Description |
|---|---|
| Average Throughput | Total bytes in a given direction divided by the total time. The total time is the periodicity of statistics uploaded from the Edge. By default, the periodicity in SASE Orchestrator is 5 minutes. |
| Total Bytes | Total number of bytes sent and received during a network session. |
| Bytes Received/Sent | Split up details of number of bytes sent and received during a network session. |
| Total Packets | Total number of packets sent and received during a network session. |
| Packets Received/Sent | Split up details of number of packets sent and received during a network session. |
| Bandwidth | The maximum rate of data transfer across a given path. Displays both the upstream and downstream bandwidth details. |
| Latency | Time taken for a packet to get across the network, from source to destination. Displays both the upstream and downstream Latency details. |
| Jitter | Variation in the delay of received packets caused by network congestion or route changes. Displays both the upstream and downstream Jitter details. |
| Packet loss | Packet loss happens when one or more packets fail to reach the intended destination. A lost packet is calculated when a path sequence number is missed and does not arrive within the re-sequencing window. A “very late” packet is counted as a lost packet. |
| Auto Dual-Mode SIM | Status of the Edge with respect to the Automatic Switchover feature configured on that Edge, and is applicable only for a 610-LTE. For more information on the Automatic Switchover feature, see Configure Automatic SIM Switchover. |
| Signal | Signal strength of the Edge indicated by the number of bars. |
Select an Edge and click the Shortcuts option at the top to perform the following activities:
- Configure – Navigates to the Configuration tab of the selected Edge. See Configure Edge Overrides.
- View Events – Displays the Events related to the selected Edge.
- Remote Diagnostics – Allows to run the Remote Diagnostics tests for the selected Edge. See Run Remote Diagnostics.
- Generate Diagnostic Bundle – Allows to generate Diagnostic Bundle for the selected Edge. See Diagnostic Bundles for Edges.
- Remote Actions – Allows to perform the Remote actions for the selected Edge. See Remote Actions.
- View Profile – Navigates to the Profile page, that is associated with the selected Edge.
- View Gateways – Displays the Gateways connected to the selected Edge.
| Option | Description |
|---|---|
| Search | Enter a search term to search for the matching text across the page. Use the advanced search option to narrow down the search results. |
| Columns | Click and select the columns to be displayed or hidden on the page. |
| Refresh | Click to refresh the page to display the most current data. |
