The Orchestrator includes special monitoring for a site deployed with a High Availability topology which are outlined in this section.
Overview
- In the SD-WAN service of the Enterprise portal, the tab now includes two HA specific improvements:
- WAN link information includes which HA Edge the link is associated with by serial number, which is especially important with Enhanced HA deployments.
- HA Interface Status.
- HA specific failover bars on the tab denoting where an HA Edge site failed over.
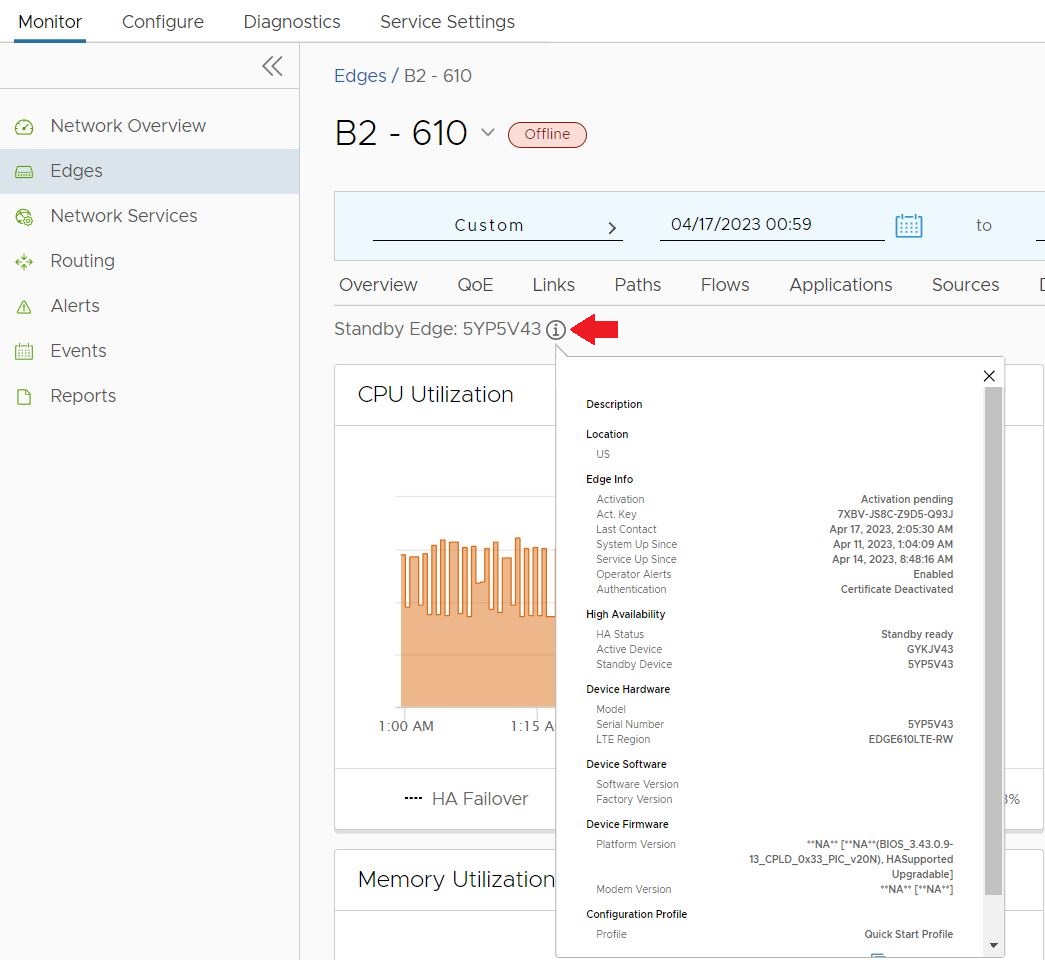
- A new tab for Standby Edge monitoring information.
High Availability specific information on the Monitor > Edge > Overview tab
In the SD-WAN service of the Enterprise portal, when you navigate to the tab, a site deployed in High Availability has added information specific to an HA deployment:
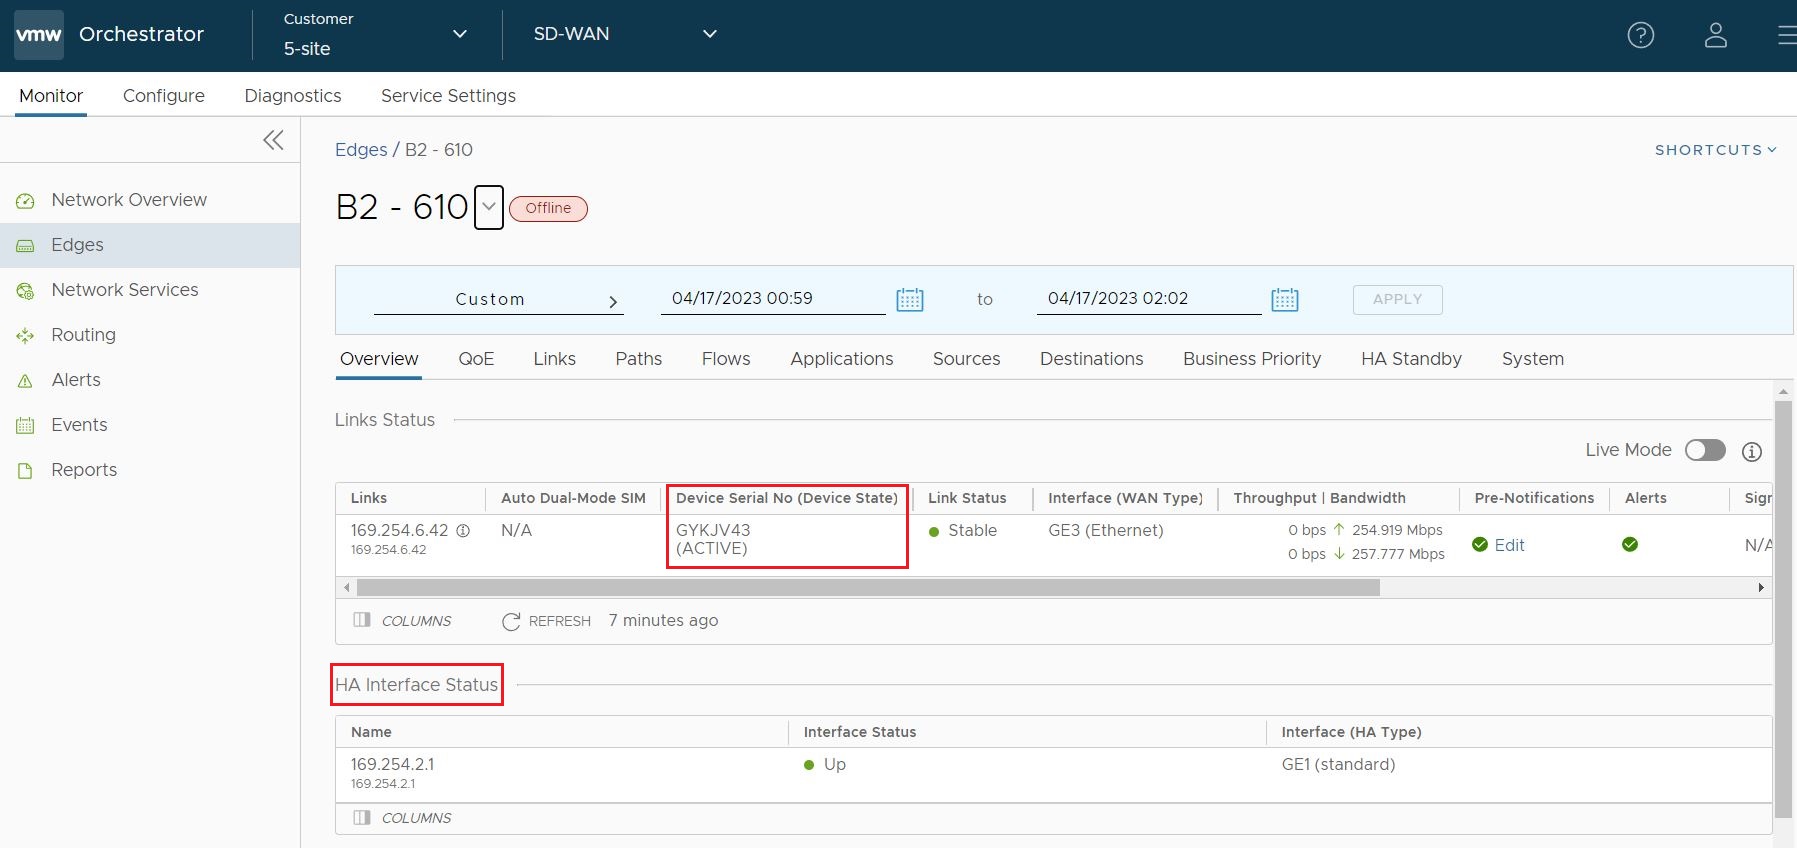
- In the Link Status section, each connected WAN link includes a column Device Serial No (Device State) that includes the Edge serial number associated with that WAN link and the HA status of that Edge (Active or Standby). This information is valuable in Enhanced HA deployments where WAN links are uniquely associated to different HA Edges and allows you to see the status of WAN links on the Standby Edge just as you see them on the Active Edge.
- The Overview tab adds an HA Interface Status section which includes the IP Address, Interface Status (Up or Down), and Interface (HA Type).
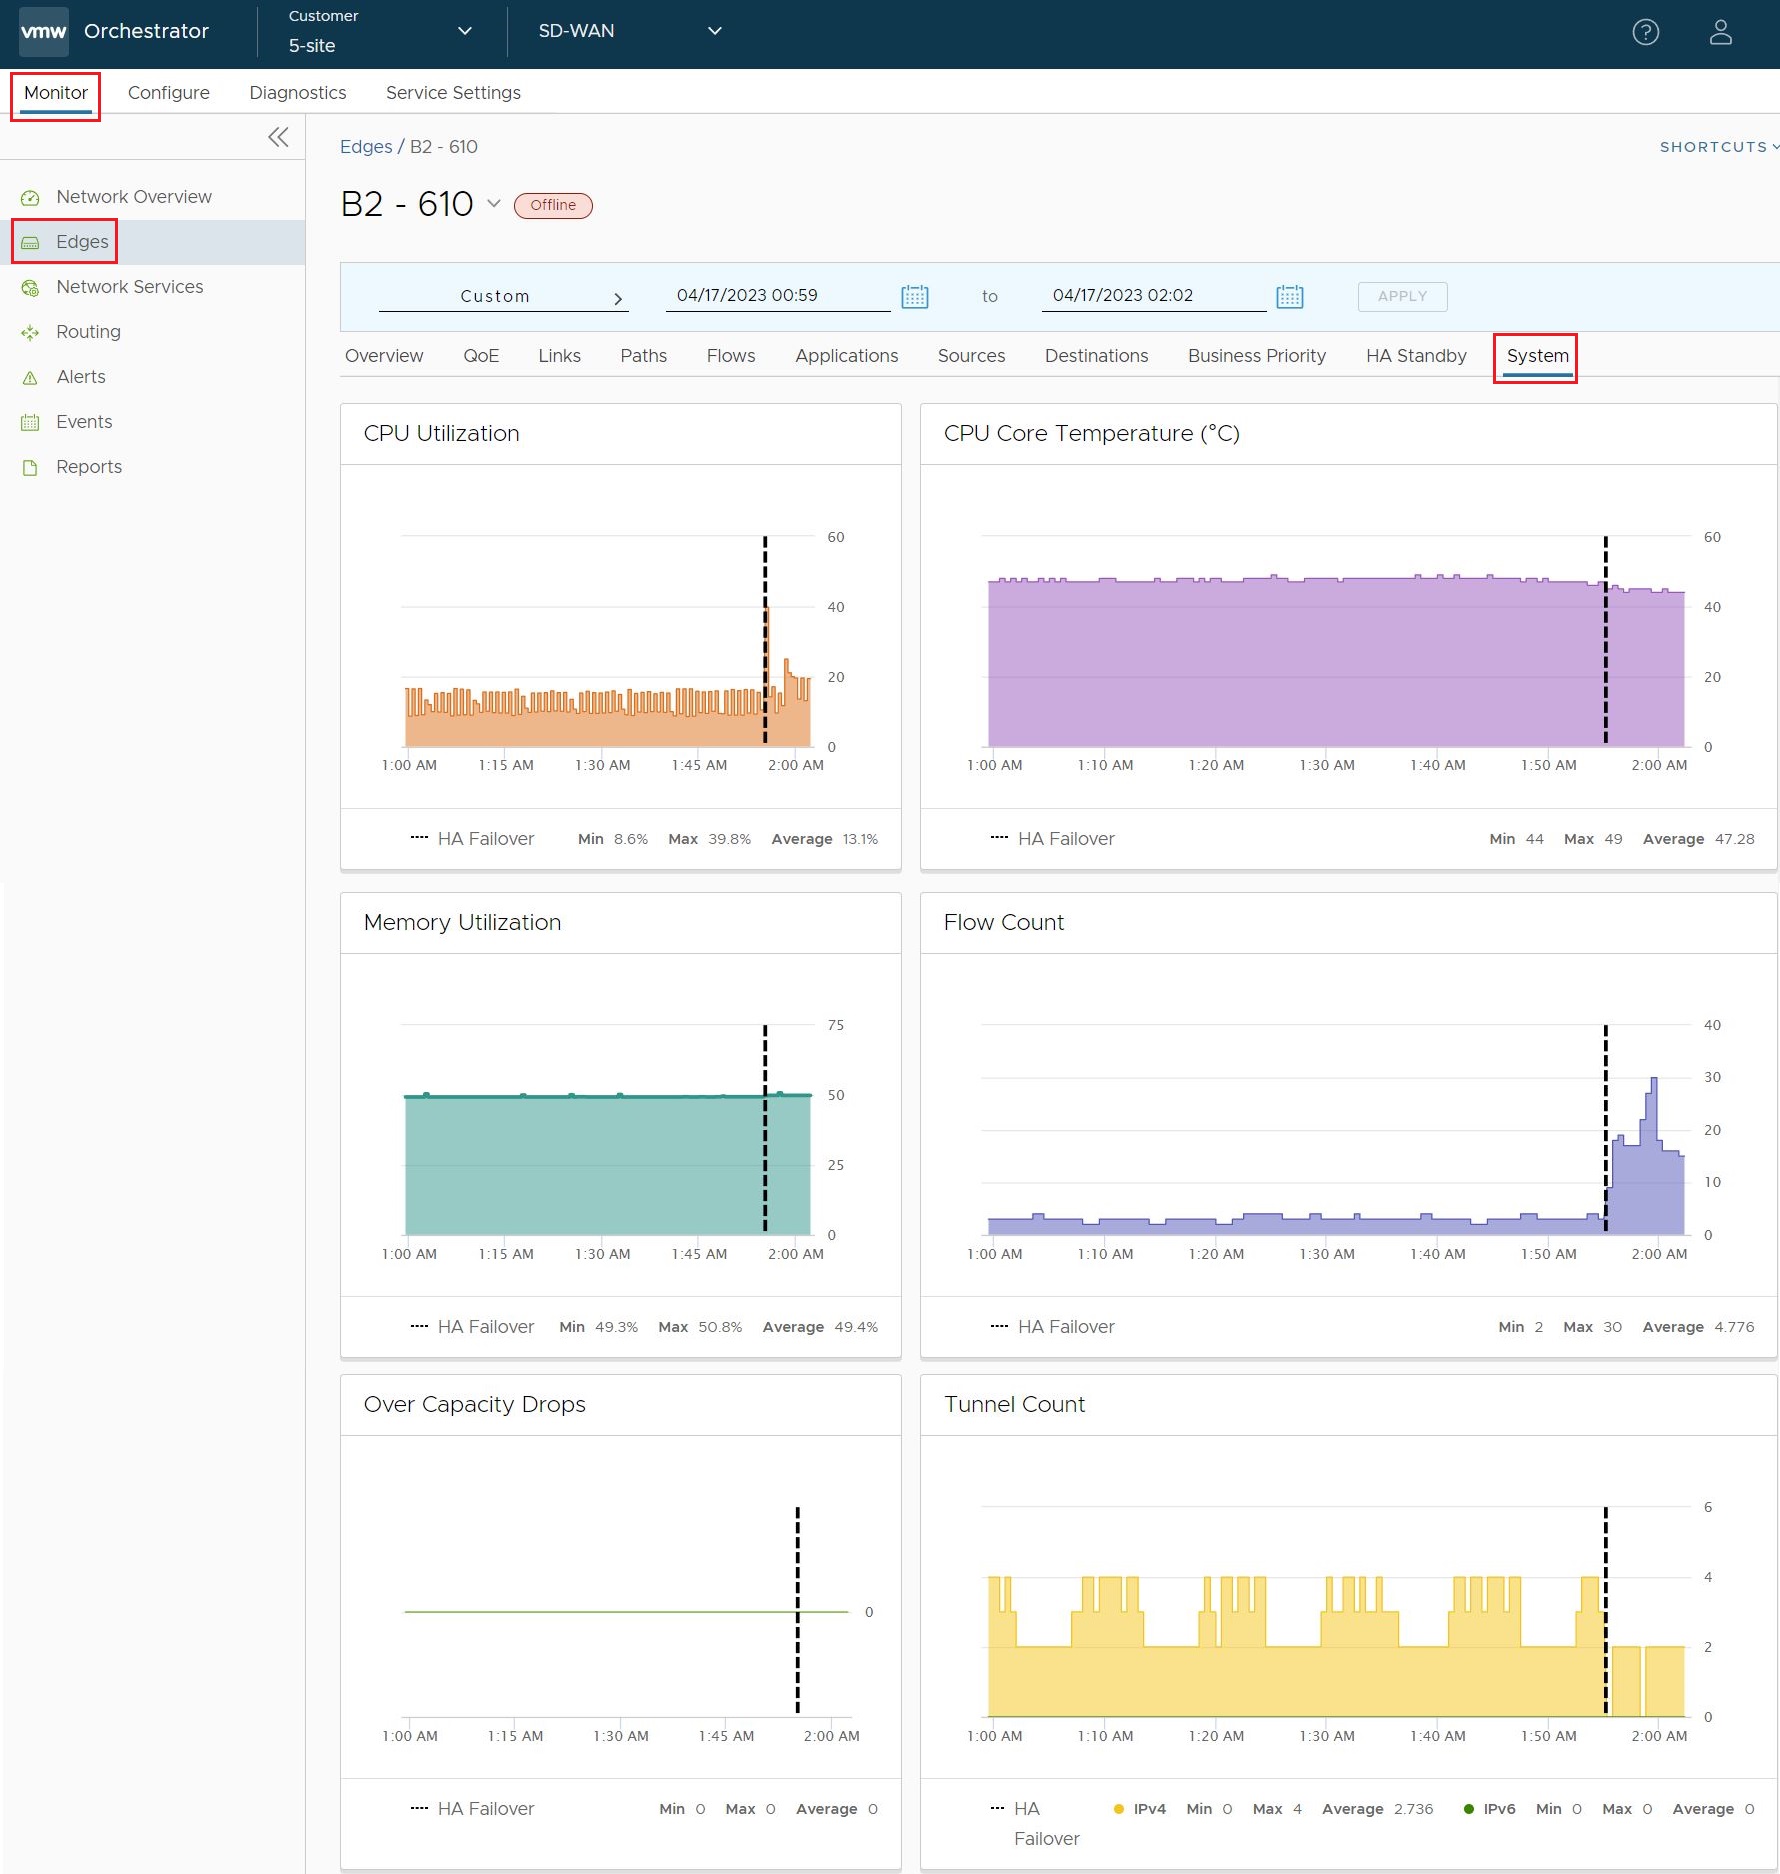
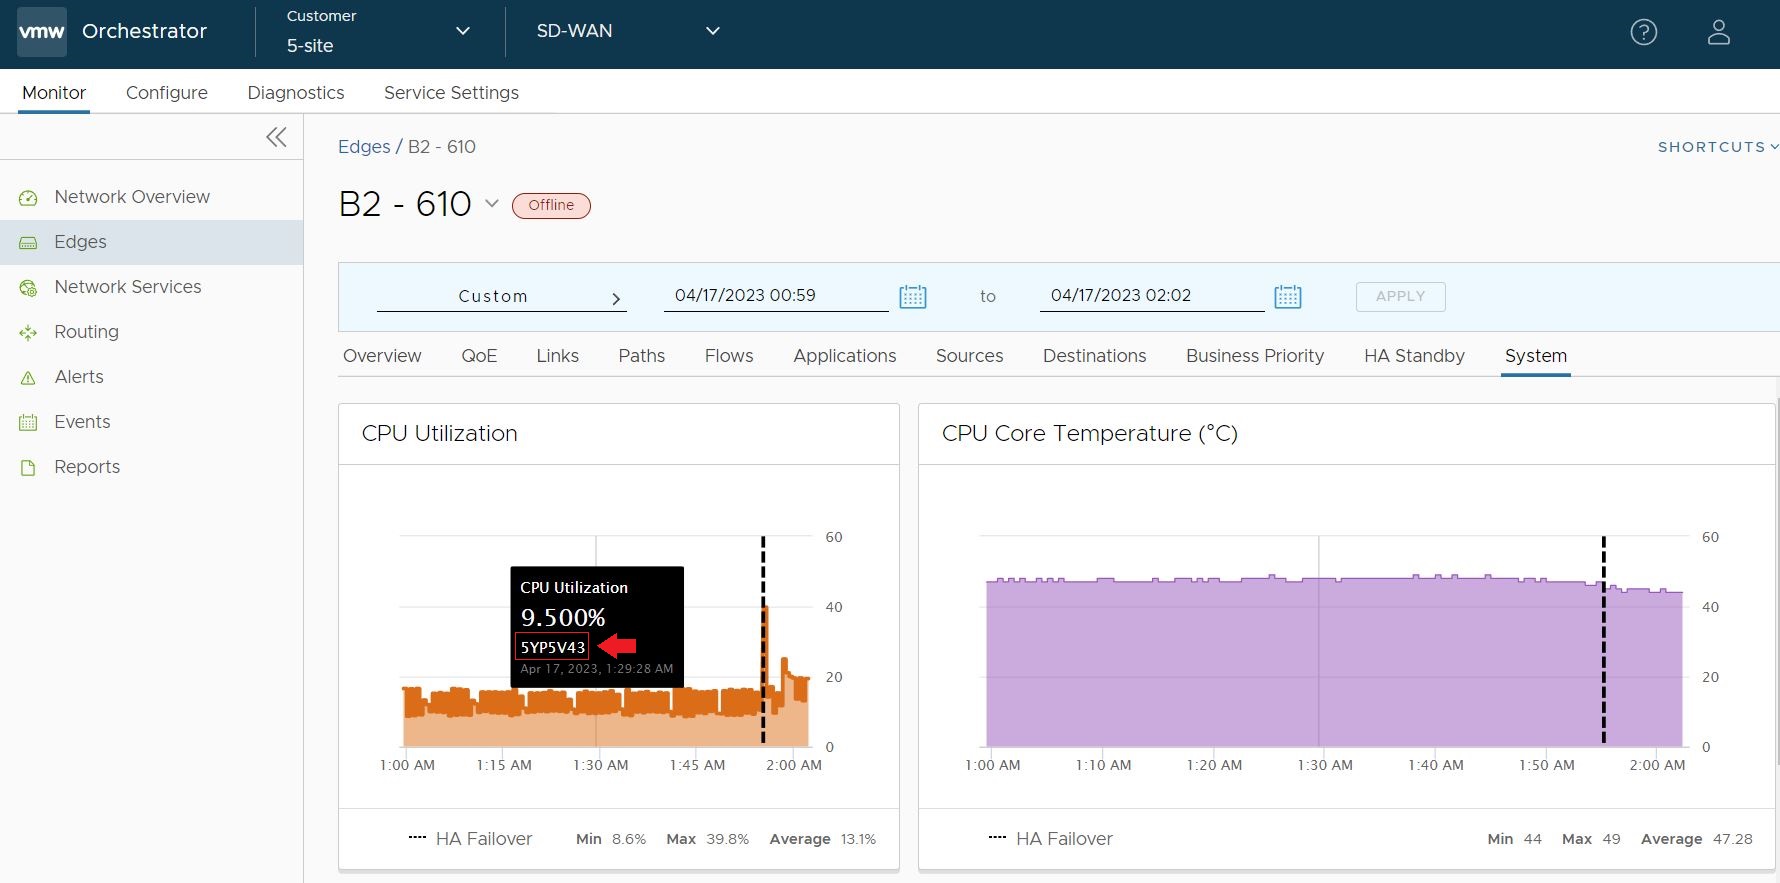
High Availability Failover Bars on the System tab
In the SD-WAN service of the Enterprise portal, when you navigate to the tab, a site deployed in High Availability has additional functionality which is best seen when a HA failover has occurred. When an HA failover occurs, the Orchestrator renders a vertical bar marking the point of the failover.
Focusing on the CPU Utilization graph, if a user hovers their mouse on the bar, the bar indicates when the failover occurred. This failover bar represents a boundary marking how the System statistics apply to each respective HA Edge when they serve as the Active Edge.
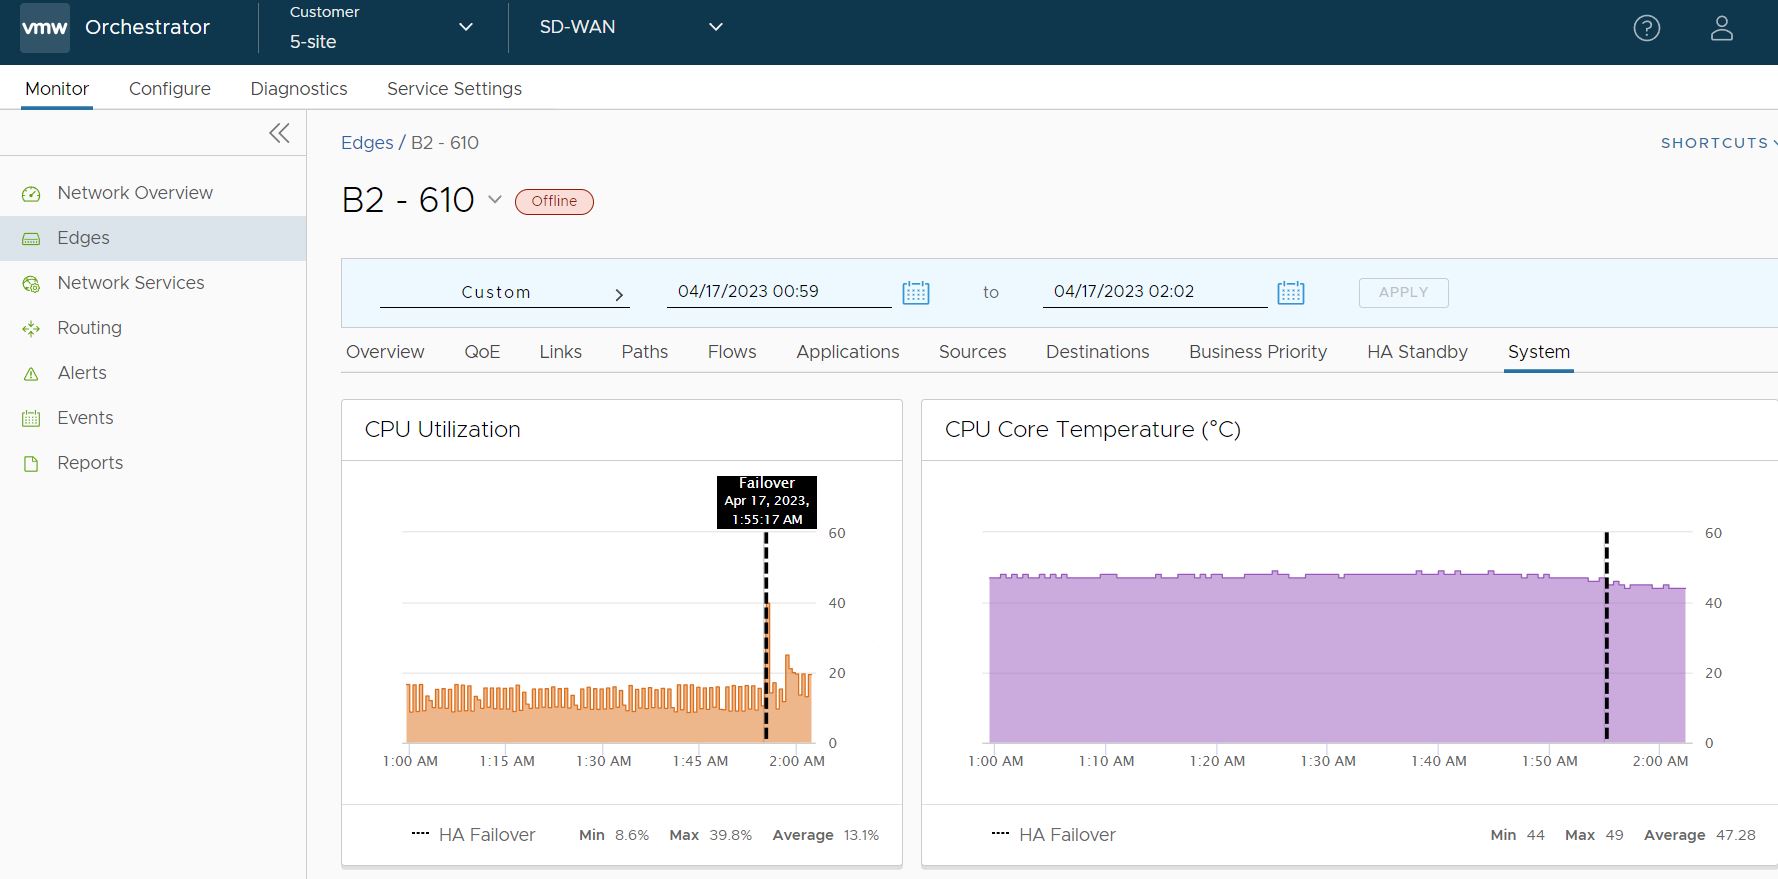
If you click on the graph to the left (earlier) side of the failover bar, the Orchestrator will indicate which Edge was Active at the time of those statistics. In this example, the Active Edge prior to the failover was Edge serial # SYP5V43.
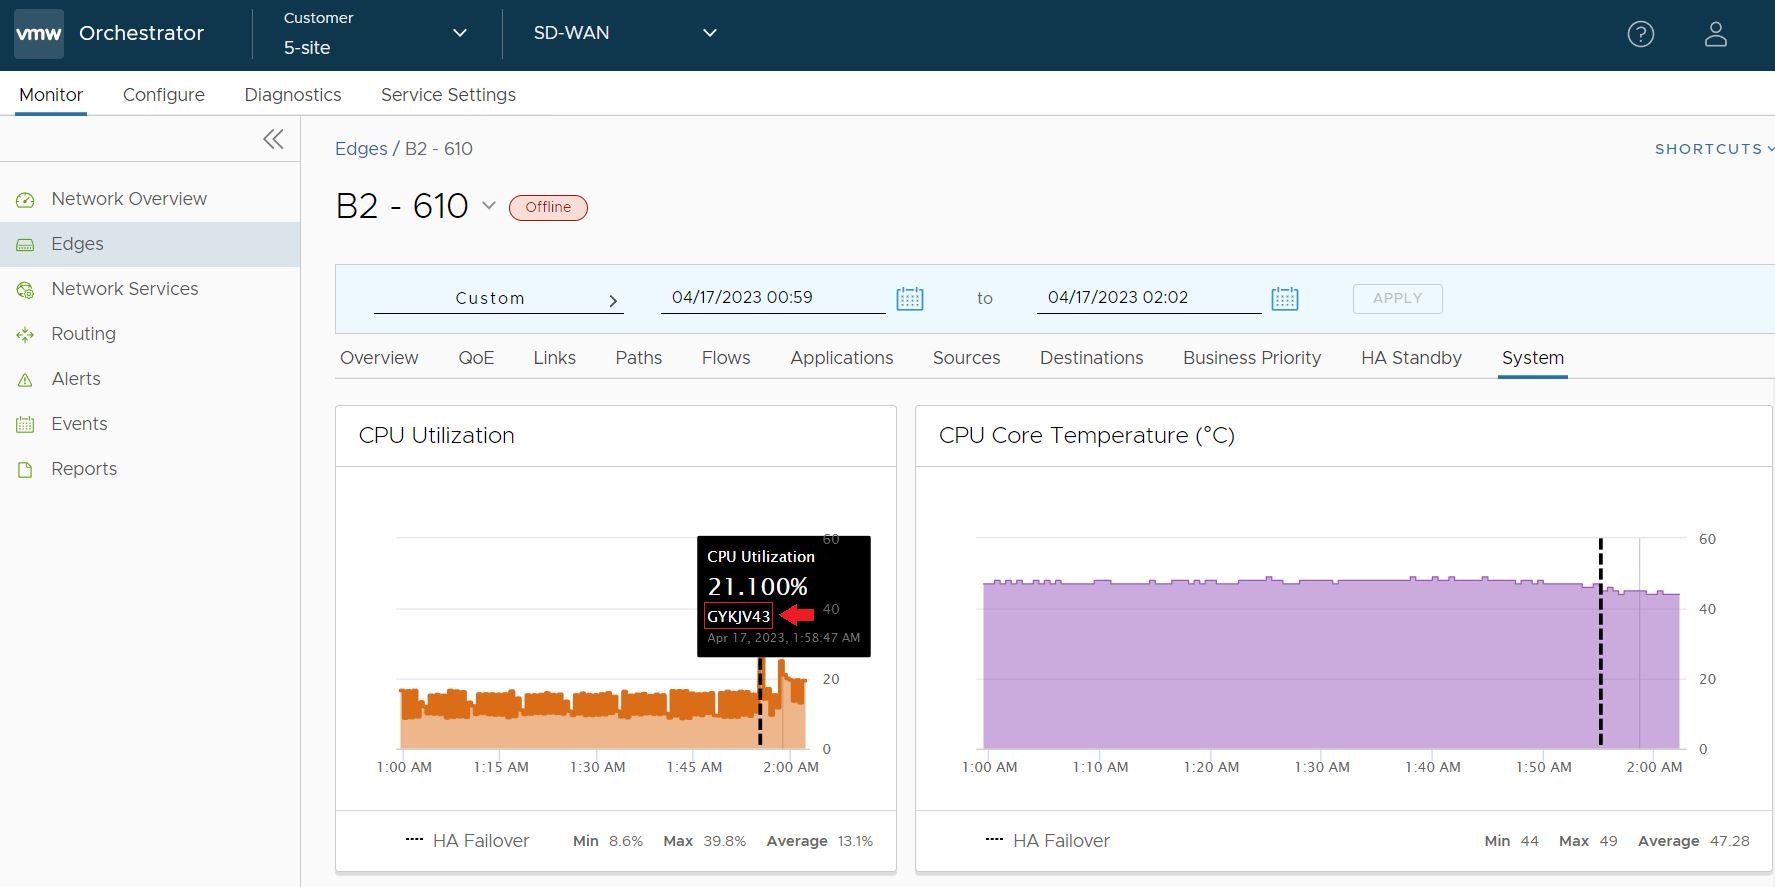
If you click on the graph to the right (later) side of the failover bar, the Orchestrator indicates that the Active Edge for the post-failover statistics is Edge serial # GYKJV43. In this way you can always know which Edge applies to which System values.
The Monitor > Edge > HA Standby Tab
You can now view the System Health statistics for the HA Edge when it is serving a standby role by clicking on the tab. This page also includes a failover bar indicating when an HA site has triggered a failover and there is now a different Edge in the role of Standby.
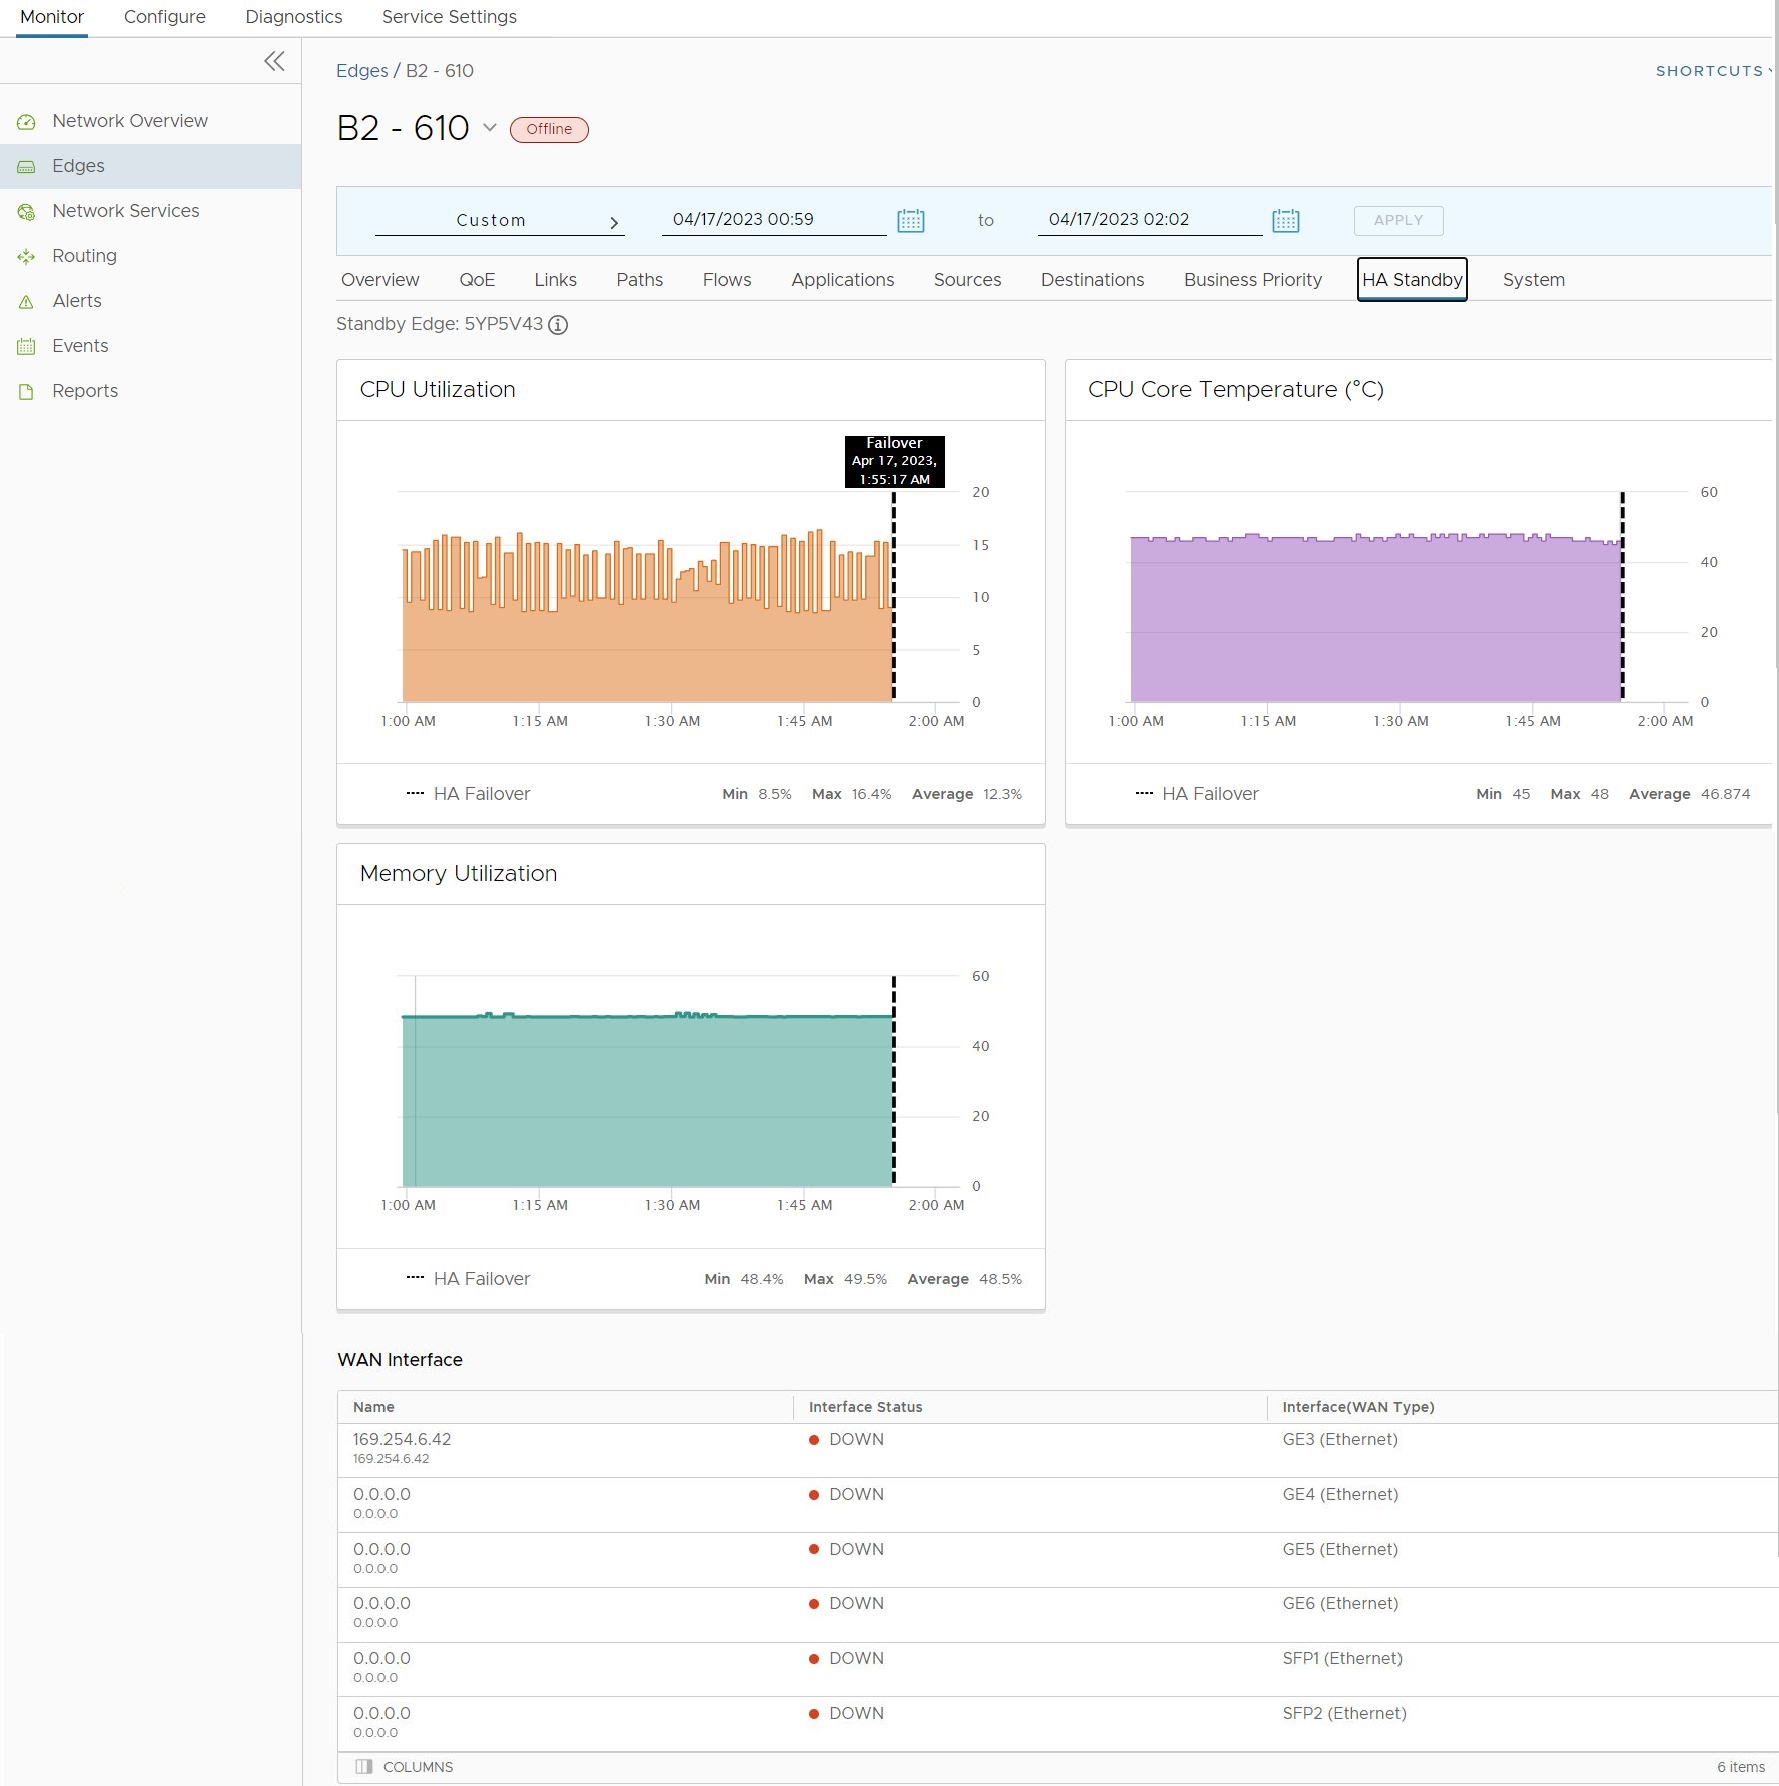
The HA Standby tab also provides live WAN Interface information which is especially helpful in Enhanced HA deployments where the Standby Edge is using unique WAN links.
Click on the information button to get Standby Edge information at the same level as what a user sees on the tab for the Active Edge.