Historical insights provide this deep understanding and trending of changes, actions, and other environmental triggers and how these relate to new findings and remediations. You can review the historical trends of events, affected objects, and remediated objects to understand historically how secure and stable your environment has been.
As a Skyline user, you want to find out how your proactive findings trended over a period of two weeks. You want to find out:
How many new findings have been surfaced?
Were those new findings based on collector changes, new products the existing collector manages, or environment changes (upgrades/ patches)?
Were those new findings based on configuration changes?
How many of the above findings were Critical, Moderate, or Trivial?
What were those findings - description, product category?
How many objects were impacted across each of the findings?
Answers to these questions allow you to view what potential issues are in front of you, when those potential issues surfaced within your environment, and what potential issues you have recently remediated.
Historical Trends uses charts to display the history of events, existing and new affected objects, and remediated objects over a specified period.
To access Historical Trends:
Click Findings & Recommendations, then click Historical Trends.
Click Days, Weeks, or Months To group Historical Trends by Days, Weeks, and Months.
The default view is the past seven days, grouped by Days. To change the period of data displayed, use the Date Range filter.
Historical Trends data might be incomplete or unavailable, if a product has/had connectivity issues with the Skyline Collector. If this happens, an error message will be displayed. See the Collector Details page for more information.
Field |
Property |
|---|---|
Events |
Click on an alert message to display the following:
Click the X on the alert pop-up message to close it. |
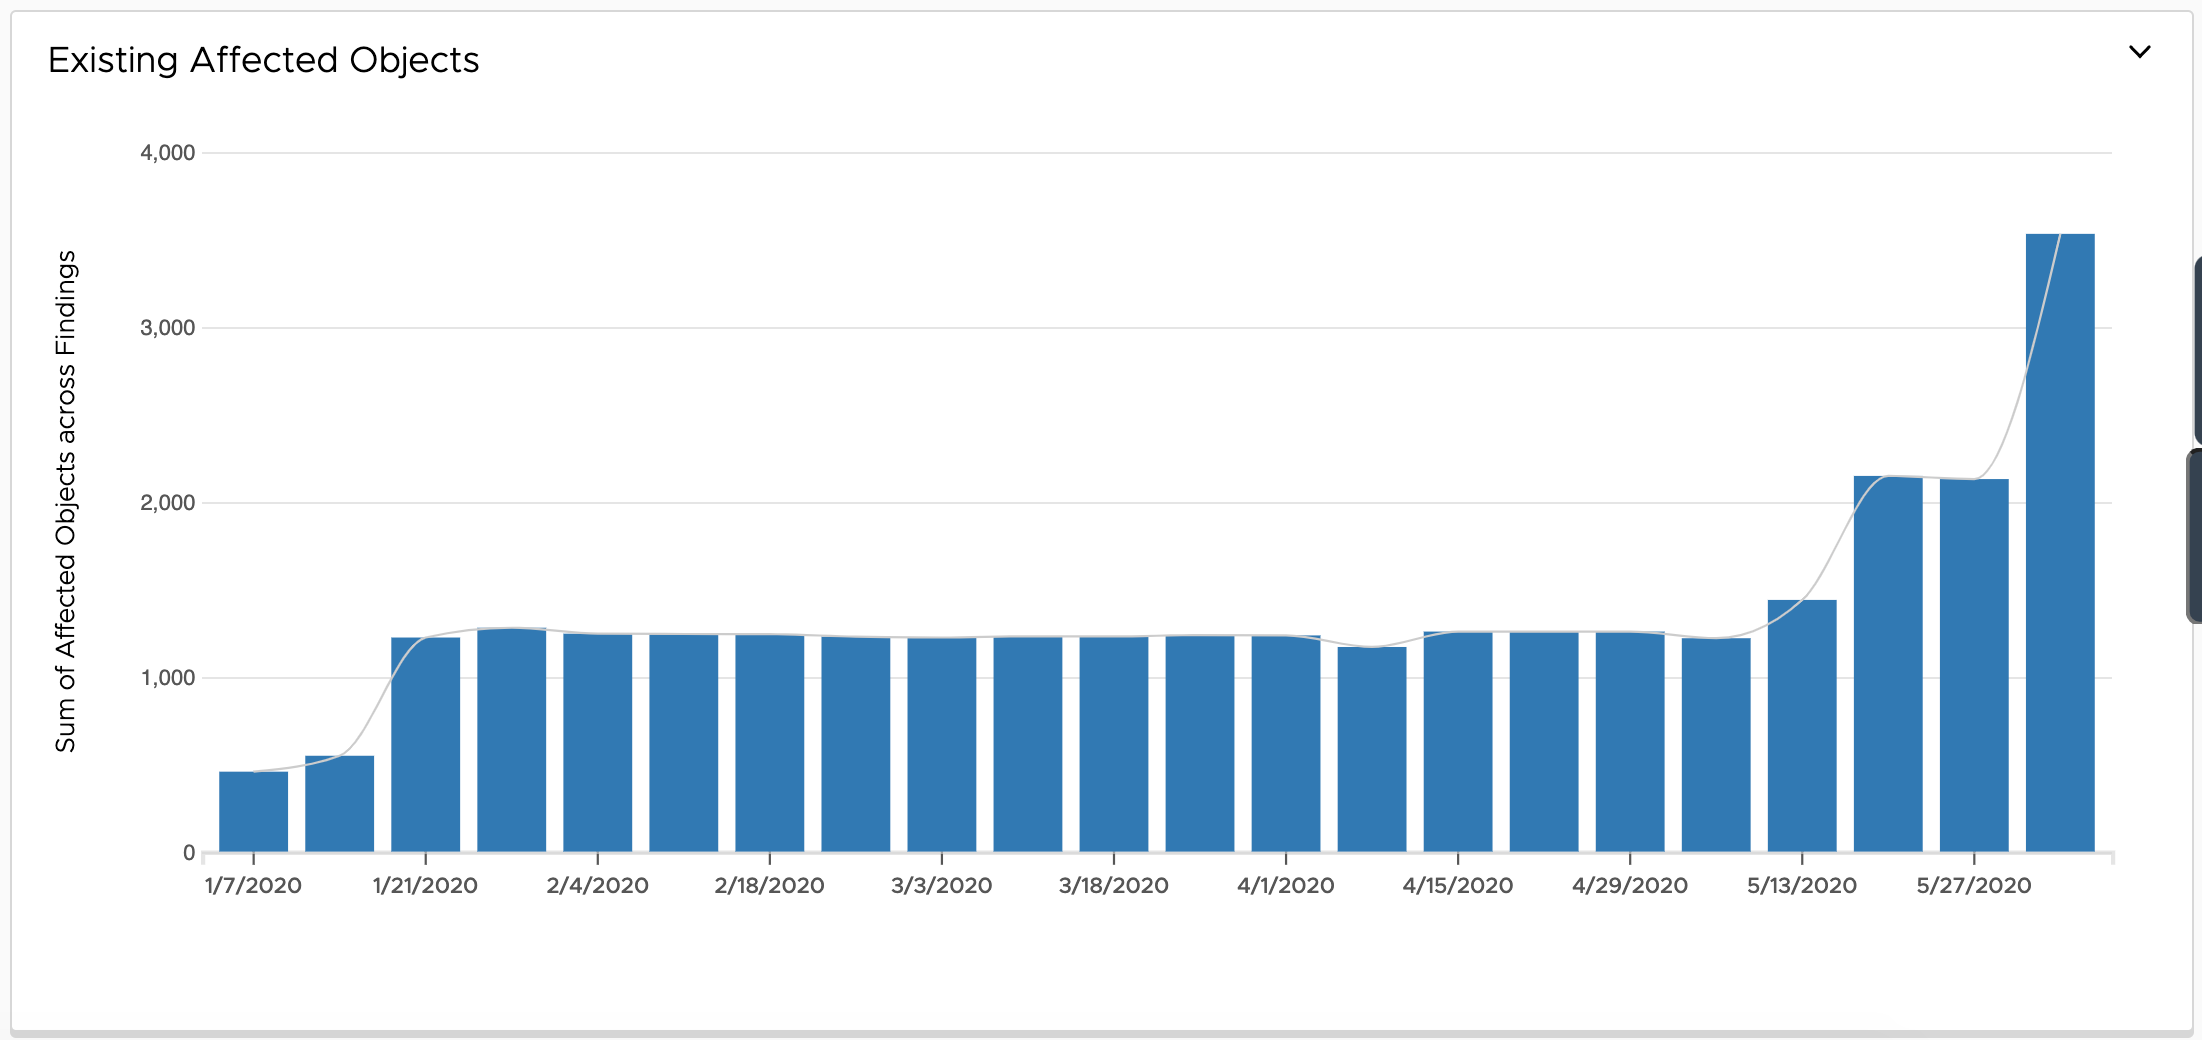
Existing Affected Objects |
Displays the total number of existing affected objects based upon the date range and data grouped by chosen. |
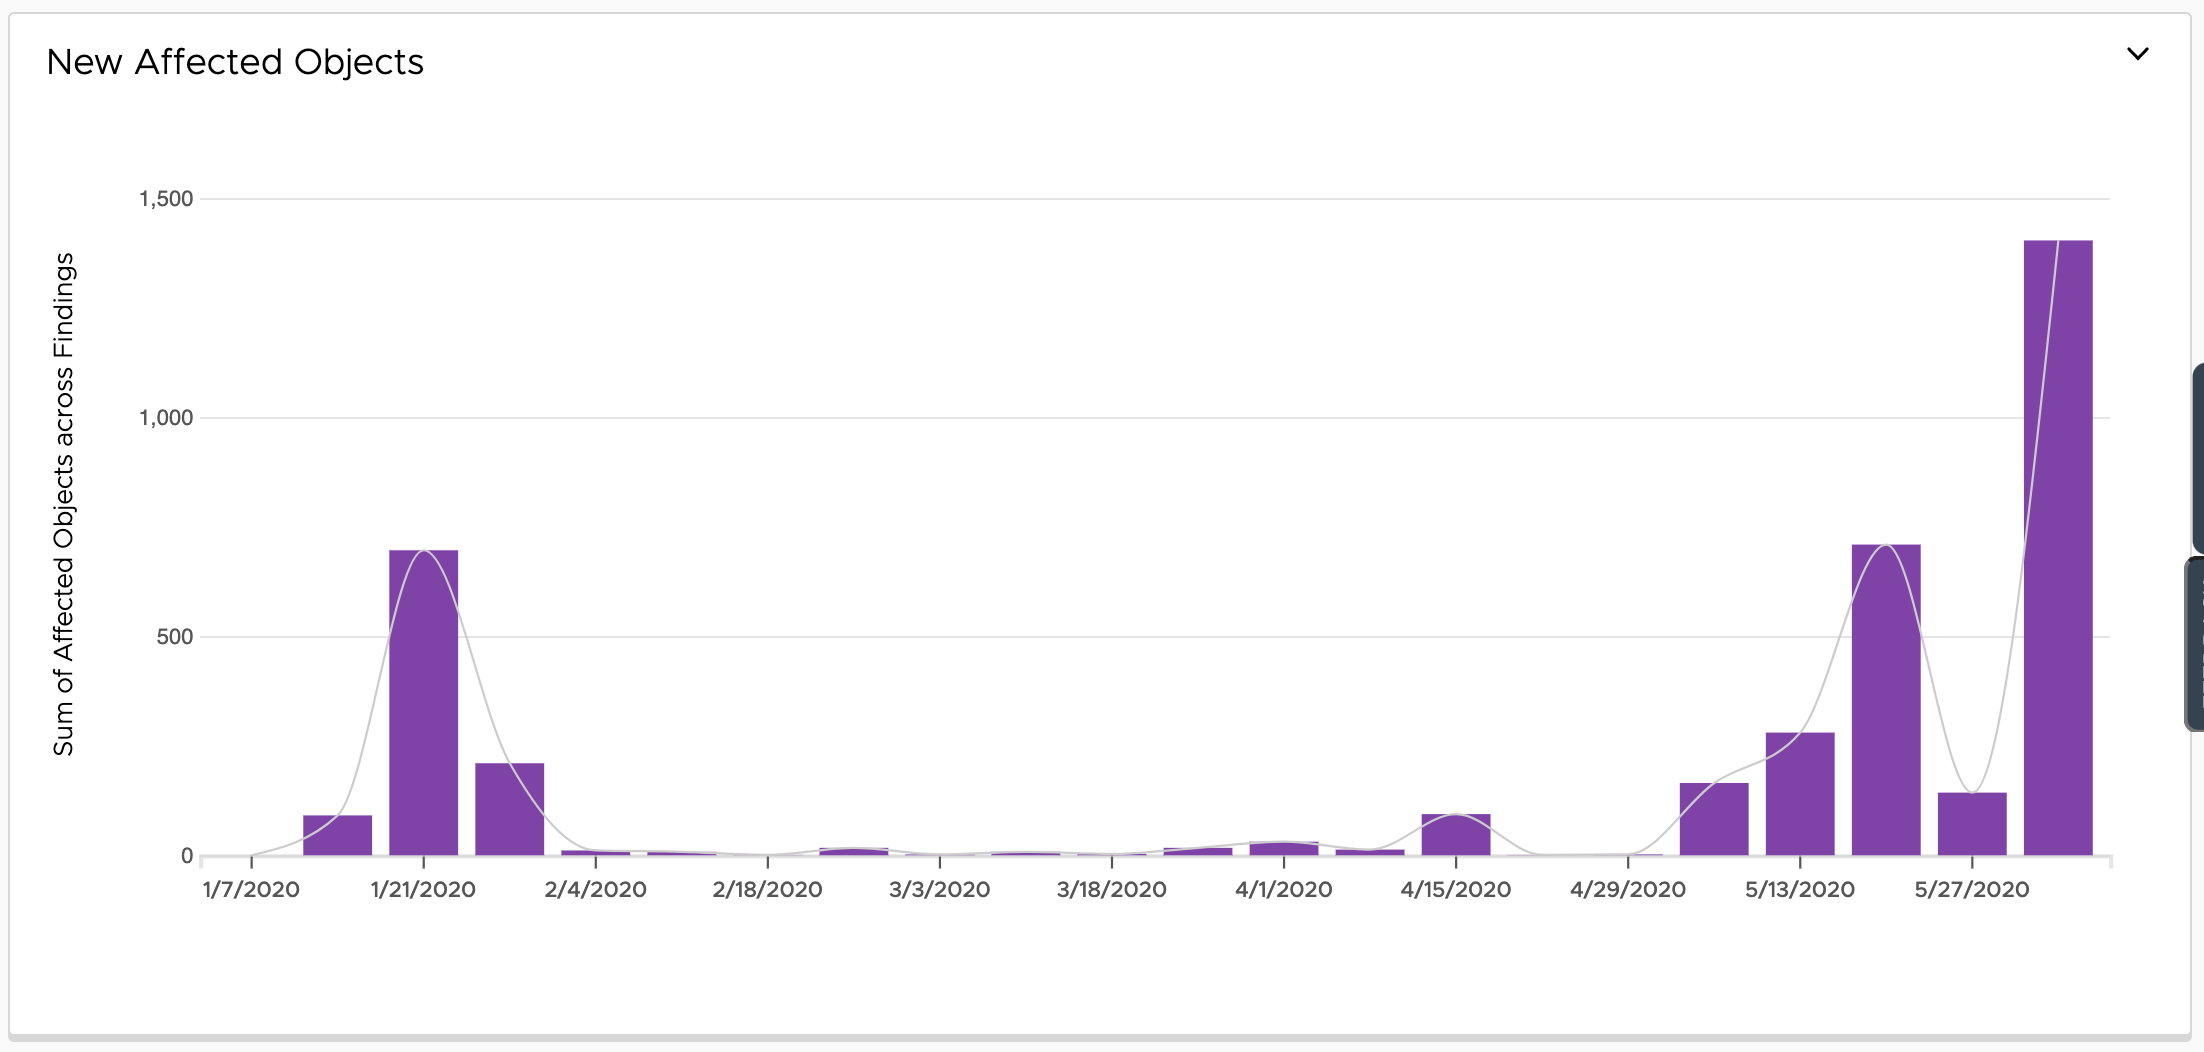
New Affected Objects |
Displays the total number of new affected objects based upon the date range and data grouped by chosen. |
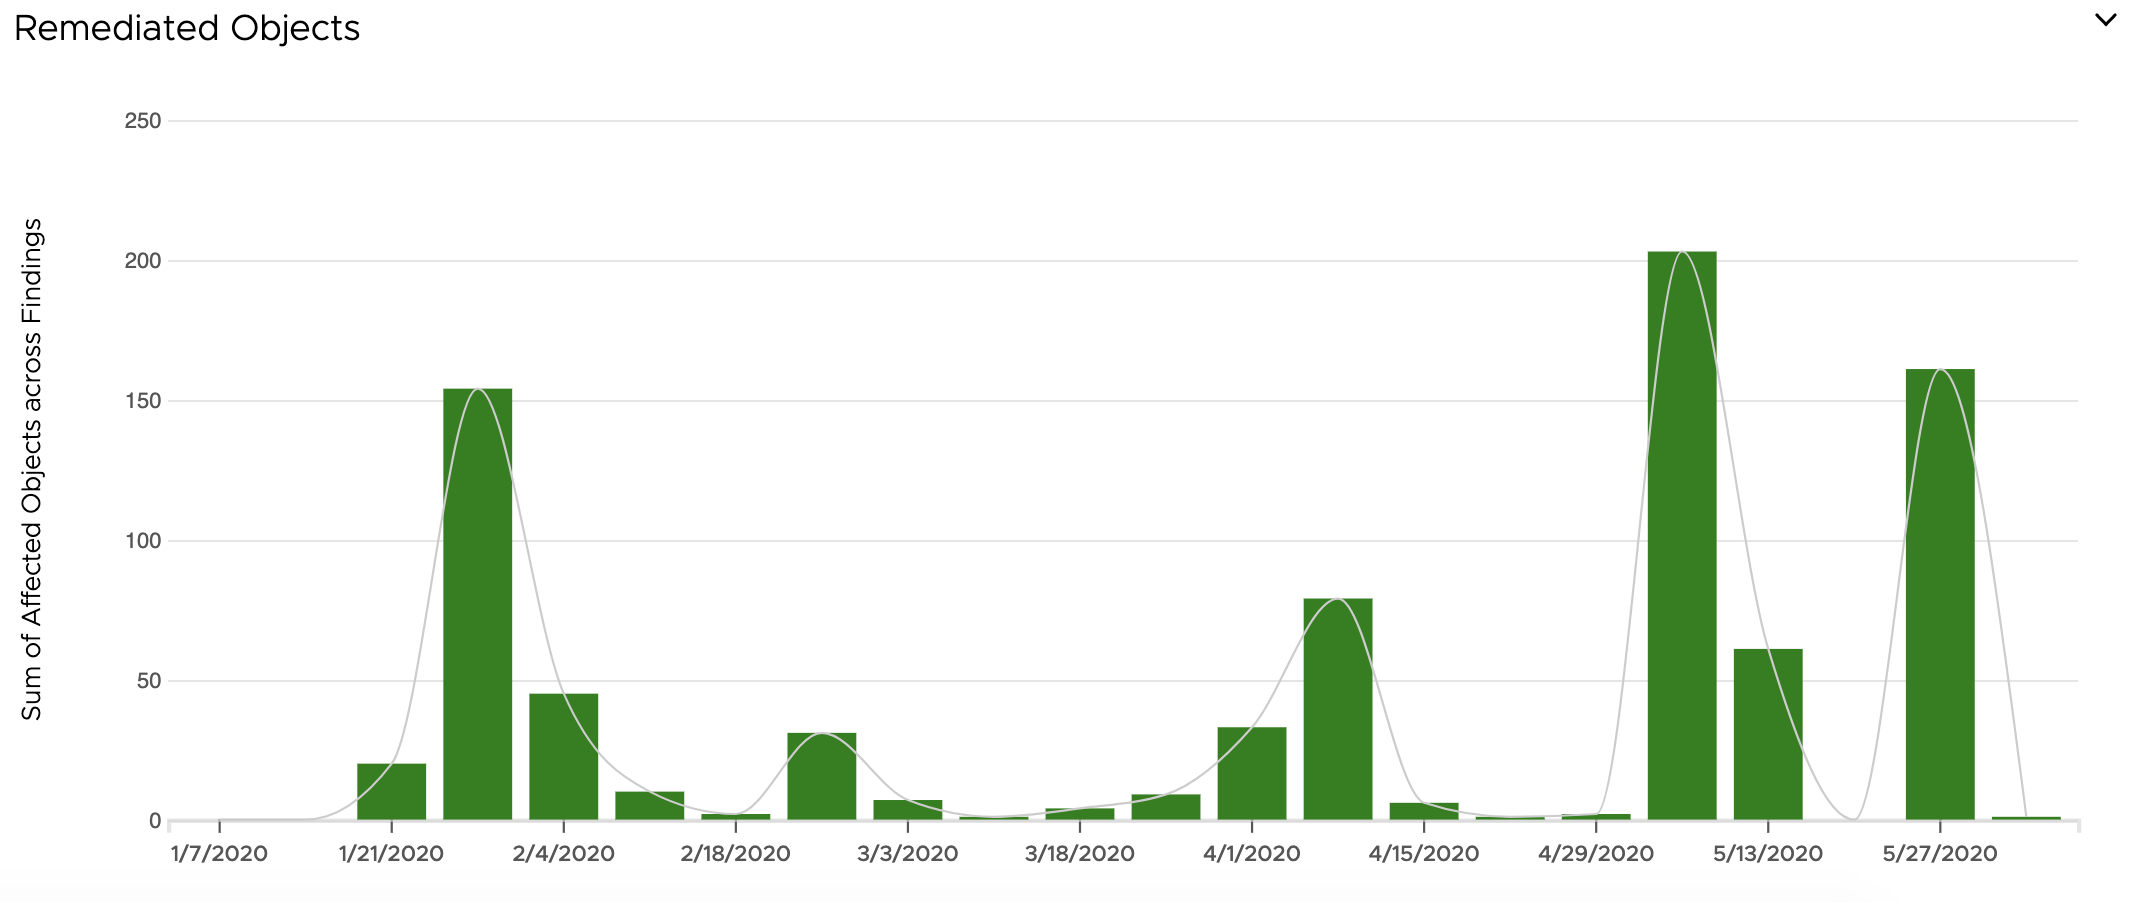
Remediated Objects |
Displays the total number of remediated objects based upon the date range and data grouped by chosen. |
How do I calculate the Total Affected Objects?
Use this example for how to determine the number of total affected objects displayed for a bar within the Existing Affected Objects, New Affected Objects, or Remediated Objects tables.
You have 10 Findings. Each Finding has 12 Affected Objects. These 12 Affected Objects appear in the Affected Objects table for each of the 10 Findings.
The value for Total Affected Objects for a day/week/month displayed in the Existing Affected Objects, New Affected Objects, or Remediated Objects will be 120.
10 Findings multipled by 12 Affected Objects = 120 Total Affected Objects
How do I view the Total Affected Objects Details?
For any of the bar graphs displayed within existing affected objects, new affected objects, or remediated objects, additional details are displayed by clicking on a chosen bar. Clicking on a bar will display all Findings, the Finding Severity, the number of Affected Objects, and the Finding Category for the chosen time period. Click export to download the list of Affected Objects in CSV format.
How to Export the Historical Findings
Clicking the export link for a particular Finding provides you with details of the Finding in CSV format. The following fields are available within the CSV:
Generation Date
Chart Type (Existing, New, Remediated)
Selected Period
Finding ID
Issue Description
Severity
Risk if no action taken
Recommendations
Reference
Hidden
Source Name, Object Name, Object Type, First Seen, Resolved as of Today ( Has the Finding been remediated as of the day you exported the file (CSV)?
Click export to download the list of Affected Objects in CSV format.
Filters
The following fields are available for filtering the existing affected objects, new affected objects, and remediated objects.
Fields |
Details |
|---|---|
Inventory |
Filter by product (vSphere, NSX-V) or the product added (vCenter Server, NSX Manager). |
Severity |
Critical, Moderate, Trivial |
Category |
Network, Storage, Security, Compute, End User Compute, Operations Management. |
Hidden Findings |
By default, any Hidden Findings are not included in Historical Trends. Check the box next to Include Hidden Findings to display includes any Findings that were hidden within the Historical Trends analysis. |
Date Range |
Choose from the Last Seven Days, the Last 30 Days, or a Custom Date Range for the displaying of Historical Trends.
Note:
The date range cannot be greater than 13 months. |
Historical Trends Examples
Existing Affected Objects
Remediated Objects